Amazon Seller Analysis
Overview Key Figures
This page can perform time-series comparisons for different key figures at different levels.
The following questions, among others, can be answered with this module:
- Which product families had the highest sales increases (sales decreases) in absolute terms this month compared to the previous month?
- Which brands generated a higher / lower contribution margin this month than in the same month last year?
- In which categories do we currently generate the highest (lowest) sales? Which marketplaces have won (lost) the most in relative terms this month?
Filter settings
Make the following three settings to use the module effectively:
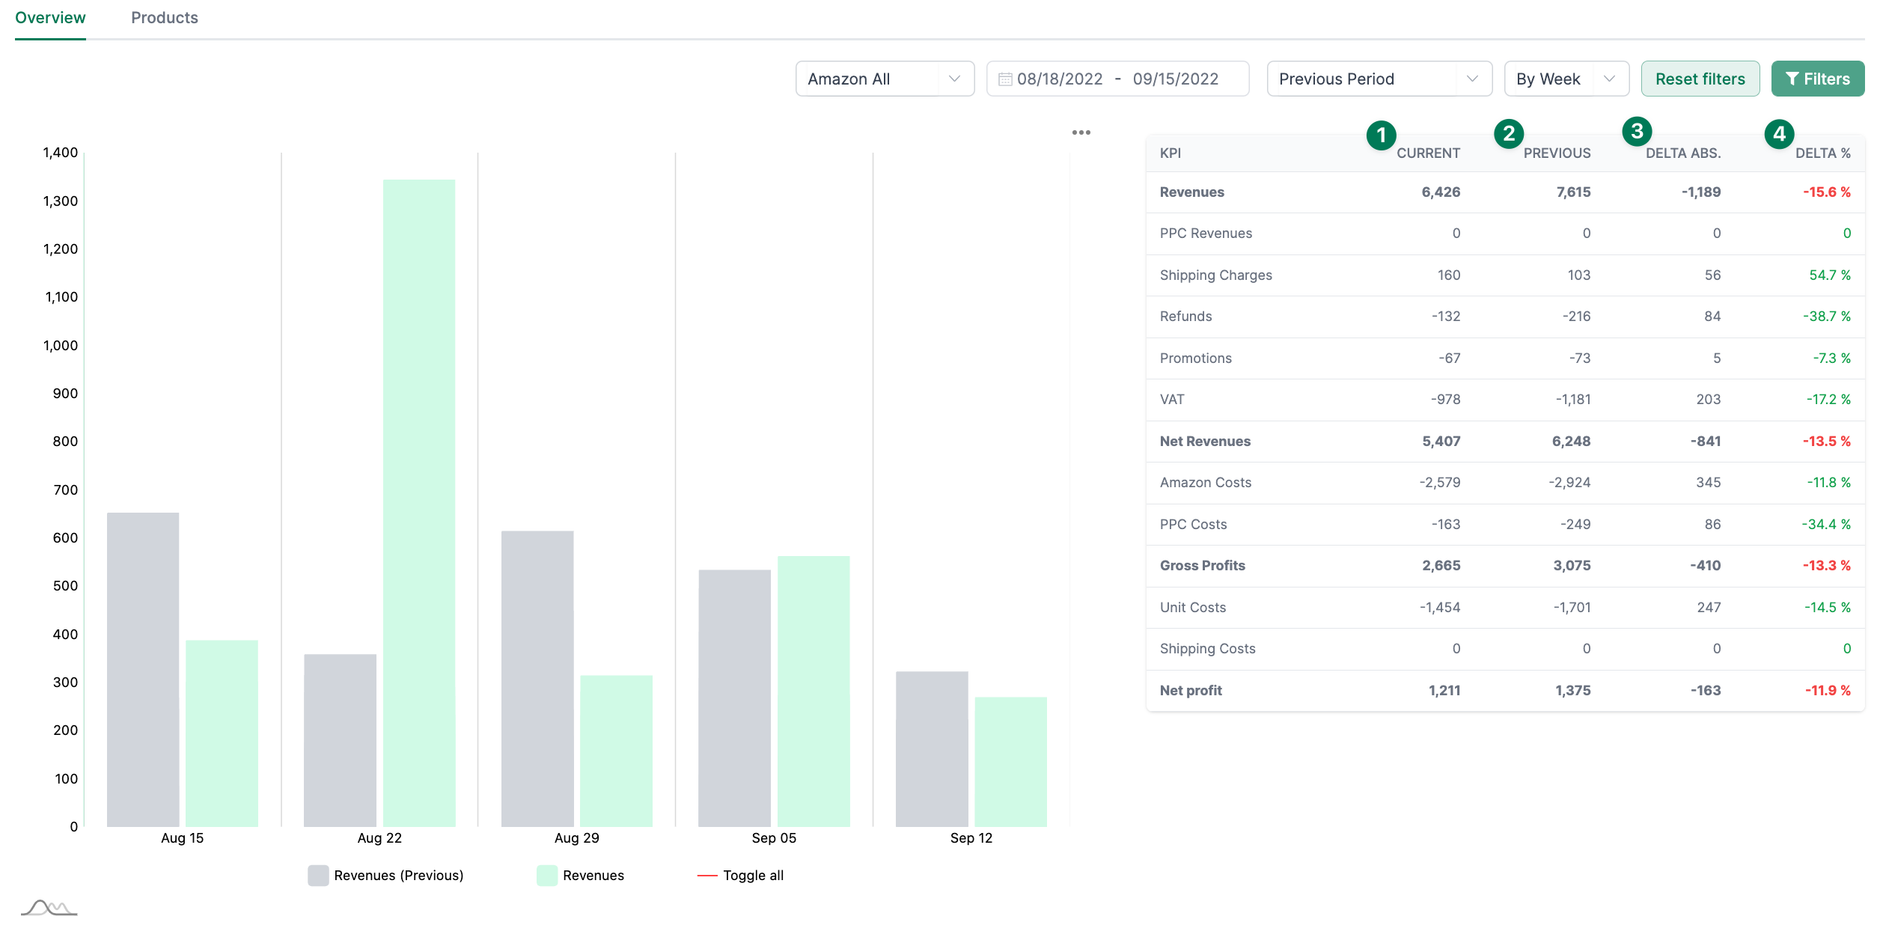
- First, choose the date range you are interested in
- Then select the KPIs you would like to compare. You can also filter, e.g. by Brand or Tags.
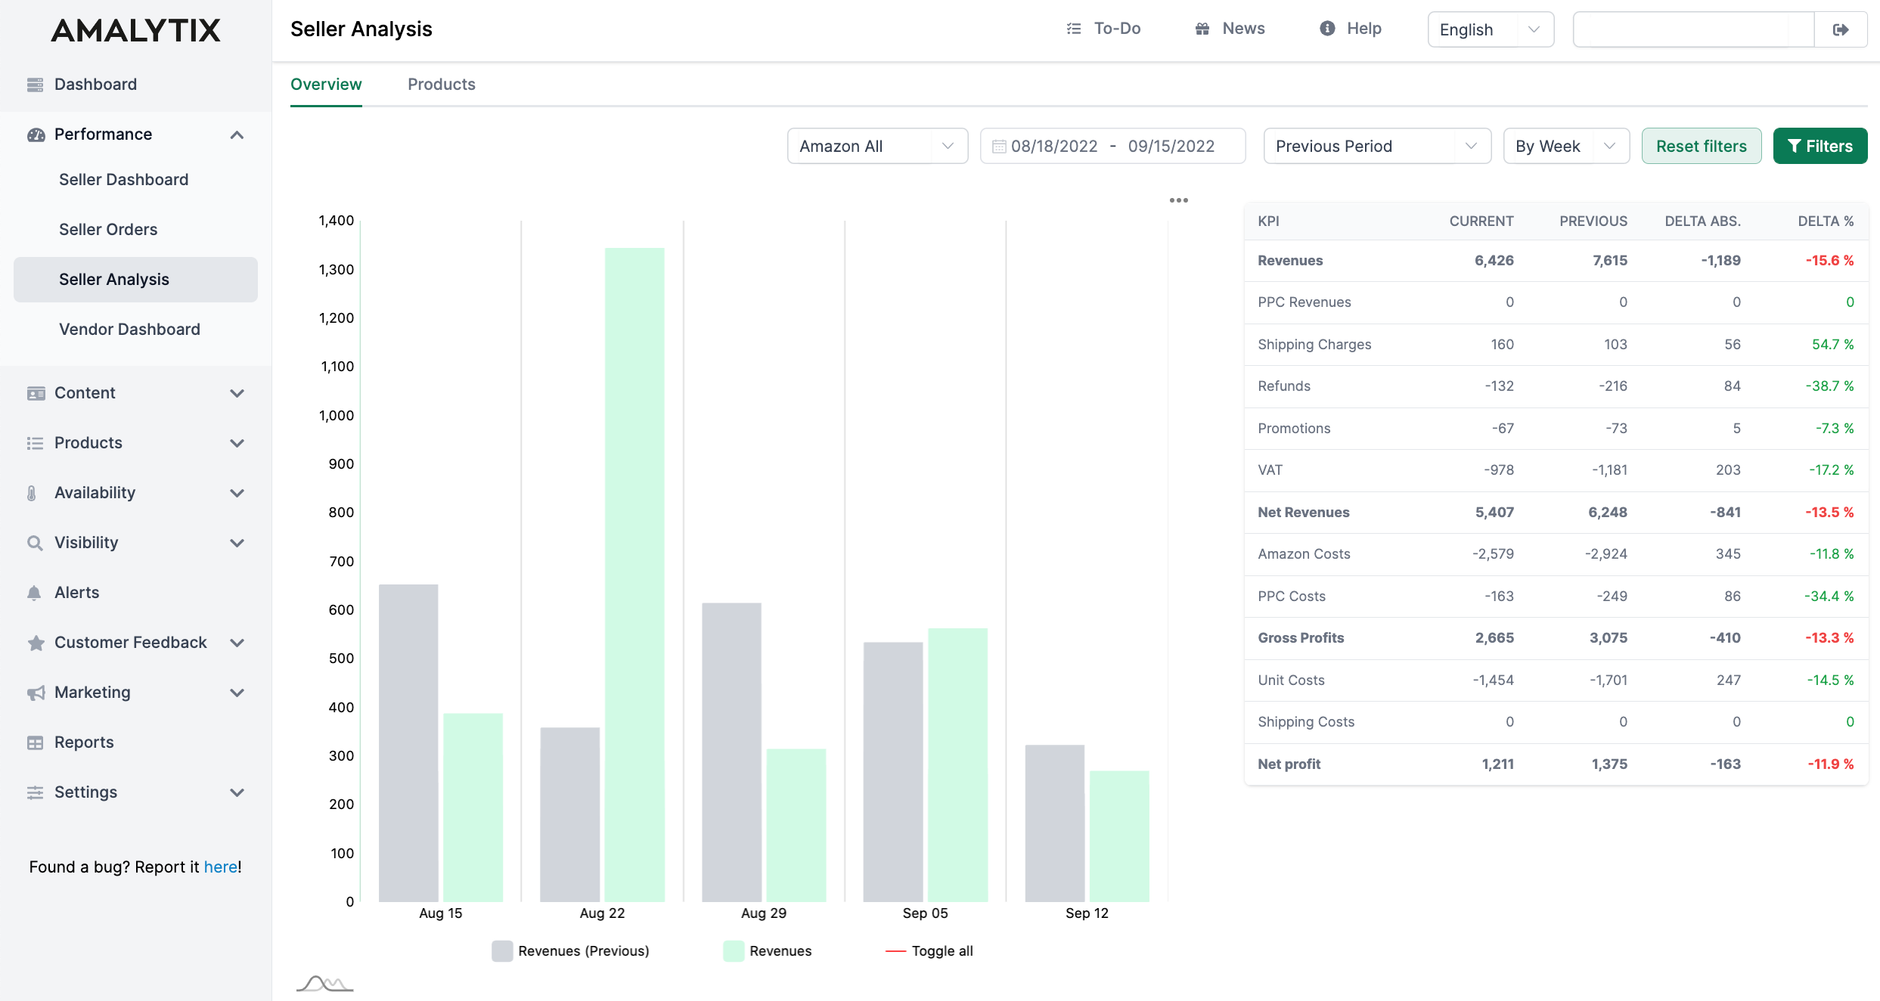
- On the top, you see the summary, and on the bottom, the breakdown per product, brand, market are whatever you have chosen Aggregation (products) filter.
These numbers are based on your payments.
Graphical progression
The graph shows the time progression of the selected key figures based on the time period selected under "Aggregation (chart)" (days, weeks, months, years).
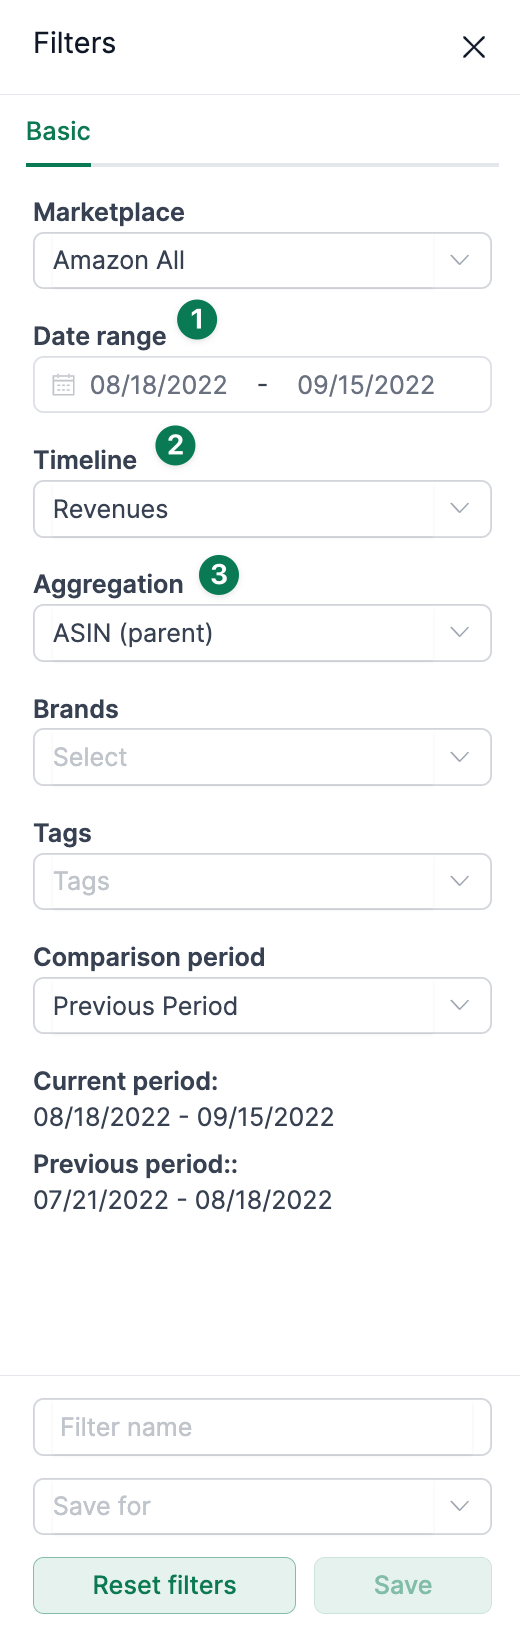
The table shows the totals and the individual cost items for both the selected period (1) and the comparison period (2). The difference is absolutely (3) and relatively (4).
Productlist
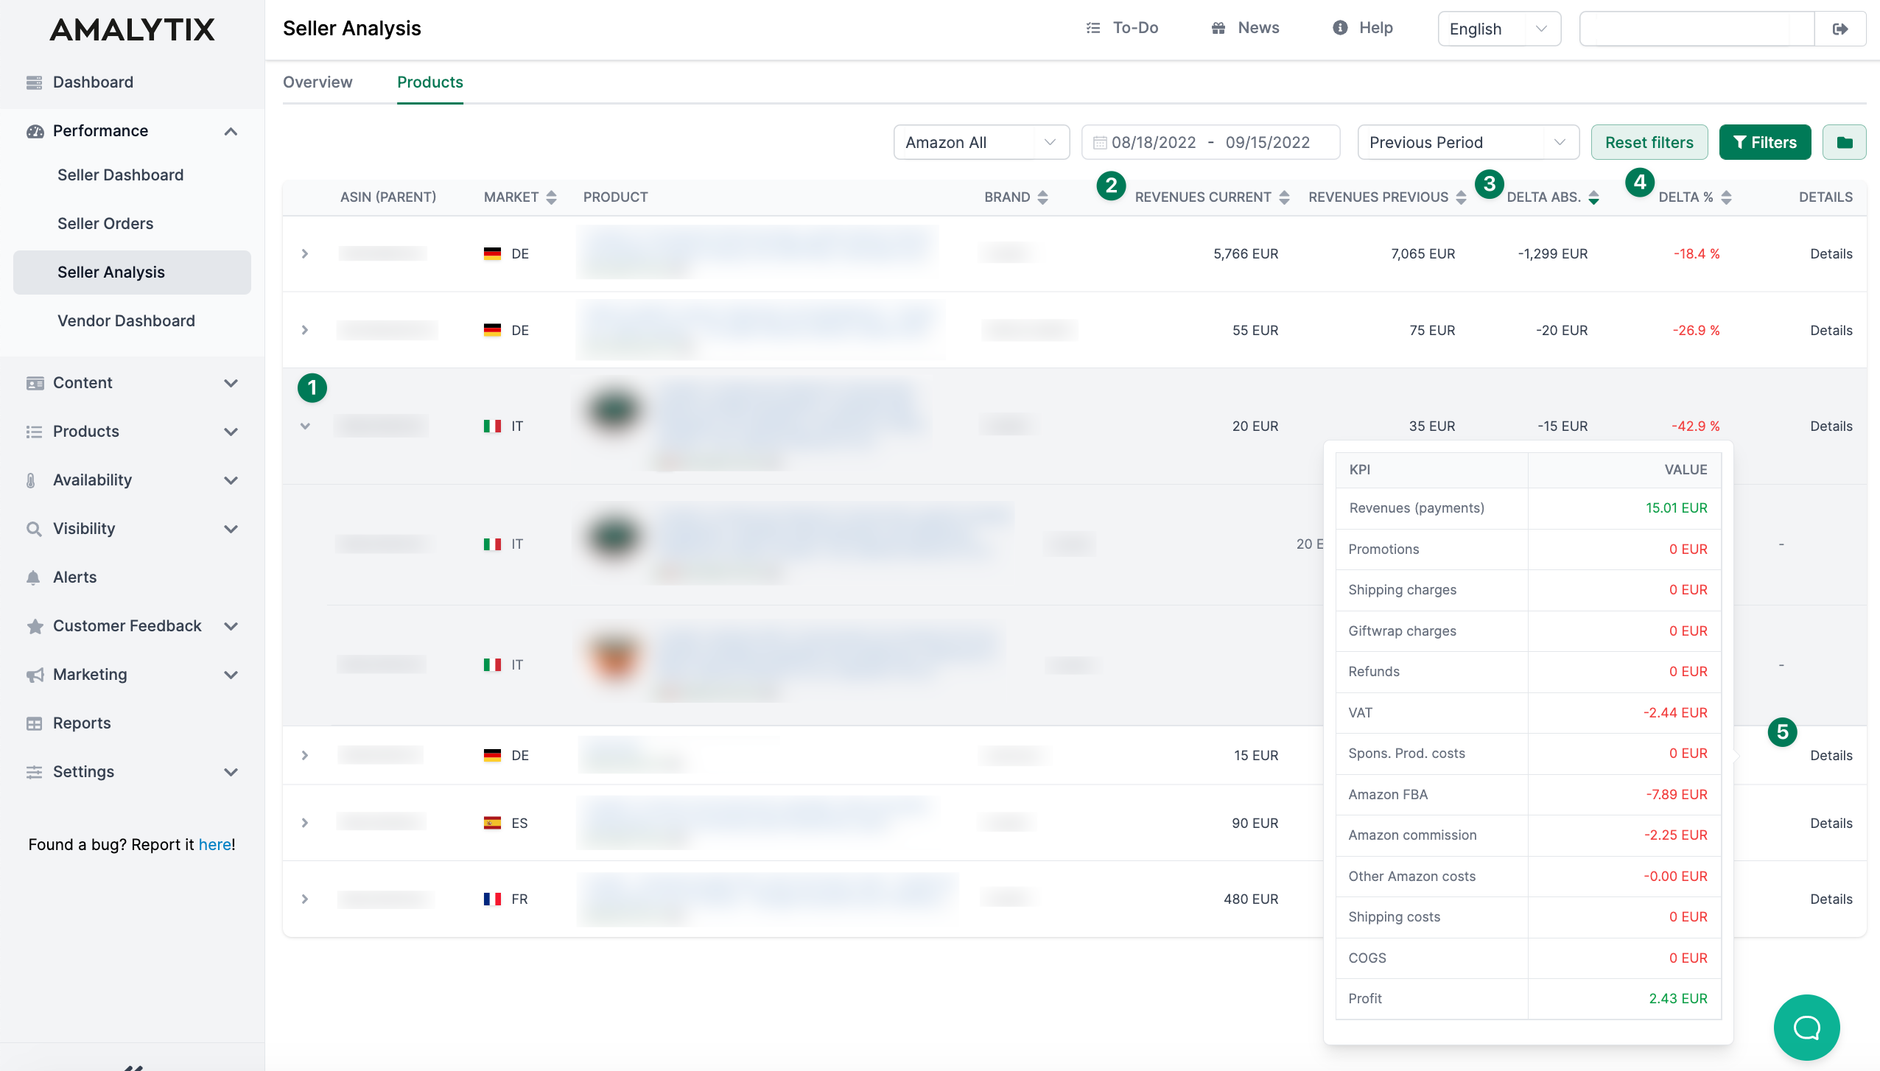
In the lower part of the page, you will find the breakdown, e.g. by product family. If you click on the arrow on the left in a row (1), you can further analyze at the level of child-ASIN.
Under (2), you will find the critical figure selected in the filter under timeline 1. Next to it is the value of the previous period. Under (3), you will find the absolute difference, and under (4), the percentage. You can also sort by all columns so that you can quickly view the products/brands/categories with
- the highest turnover or
- the greatest change in sales (absolute) or
- the greatest change in sales (relative)
By clicking on Details (5), you can view various KPIs for your product.
Available Amazon reports
You also have the possibility of exporting specific key figures as a report. To do this, go to the Performance time comparison and set a marketplace and a start and end date, if necessary, to limit the result.
Performance time comparison report
- Description: Compares key performance metrics between two time ranges you can define. Compared are order, financial, listing, and session / conversion data
- Type: Seller
- Category: Performance
A list of all columns of this report can be found here →.