Amazon Vendor Analysis
Overview
On the Vendor Analysis page, you can perform time series comparisons for different metrics at different levels.
You can use this module to answer the following questions, among others:
- Which Child ASINs had the highest absolute sales increases/decreases this month compared to the previous month?
- Which brands had a higher/lower contribution margin this month than last year?
- In relative terms, which marketplaces have gained/lost the most this year?
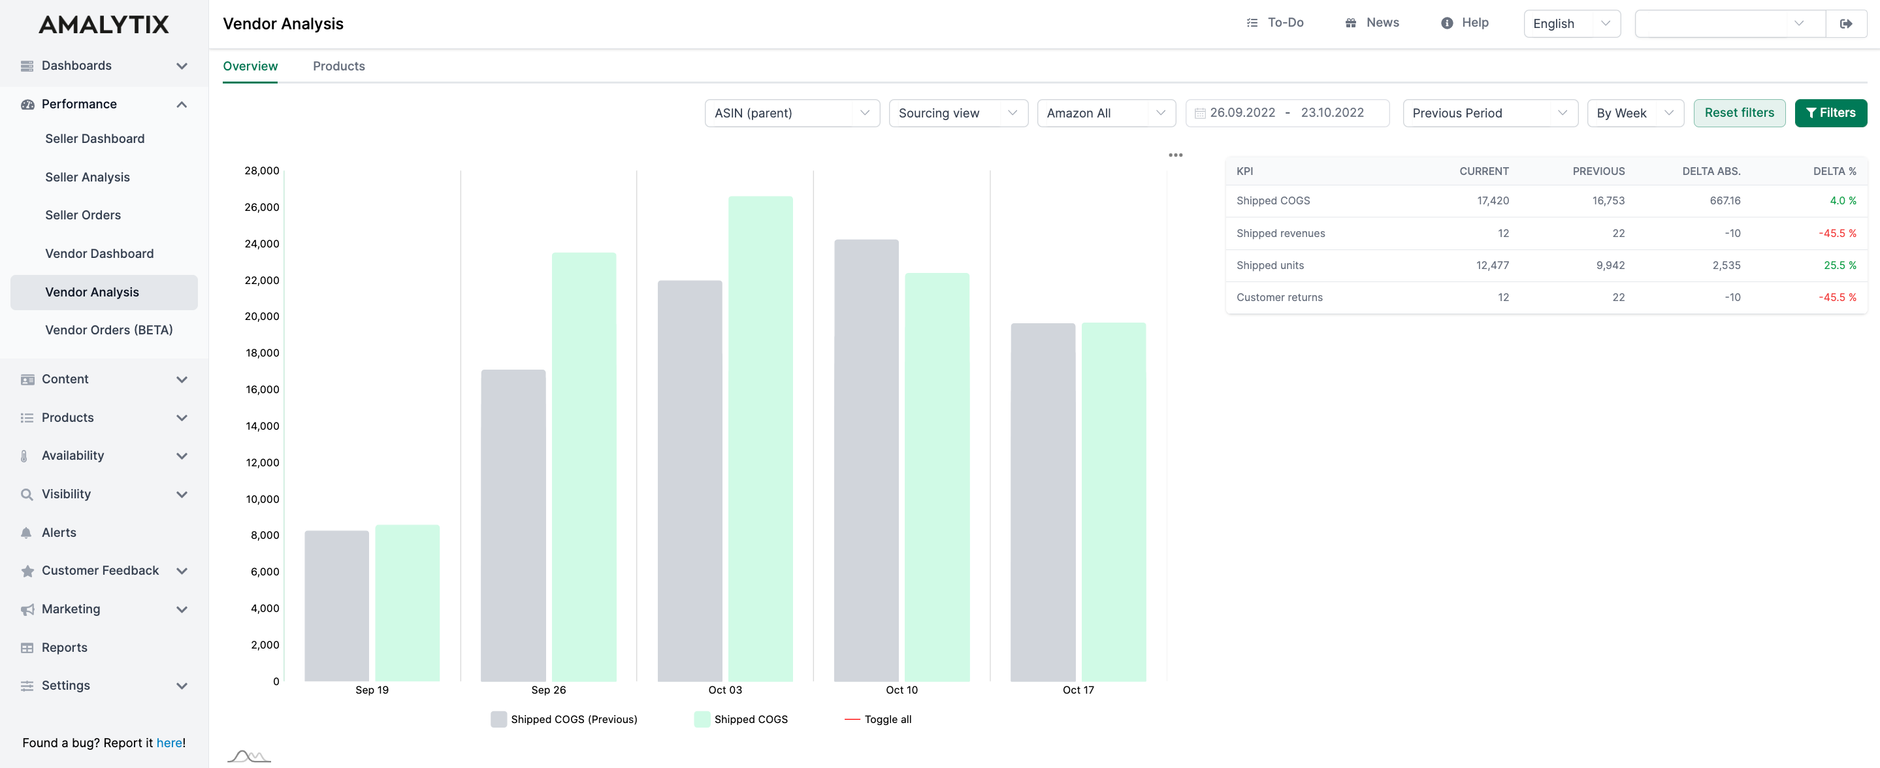
Period comparison (total)
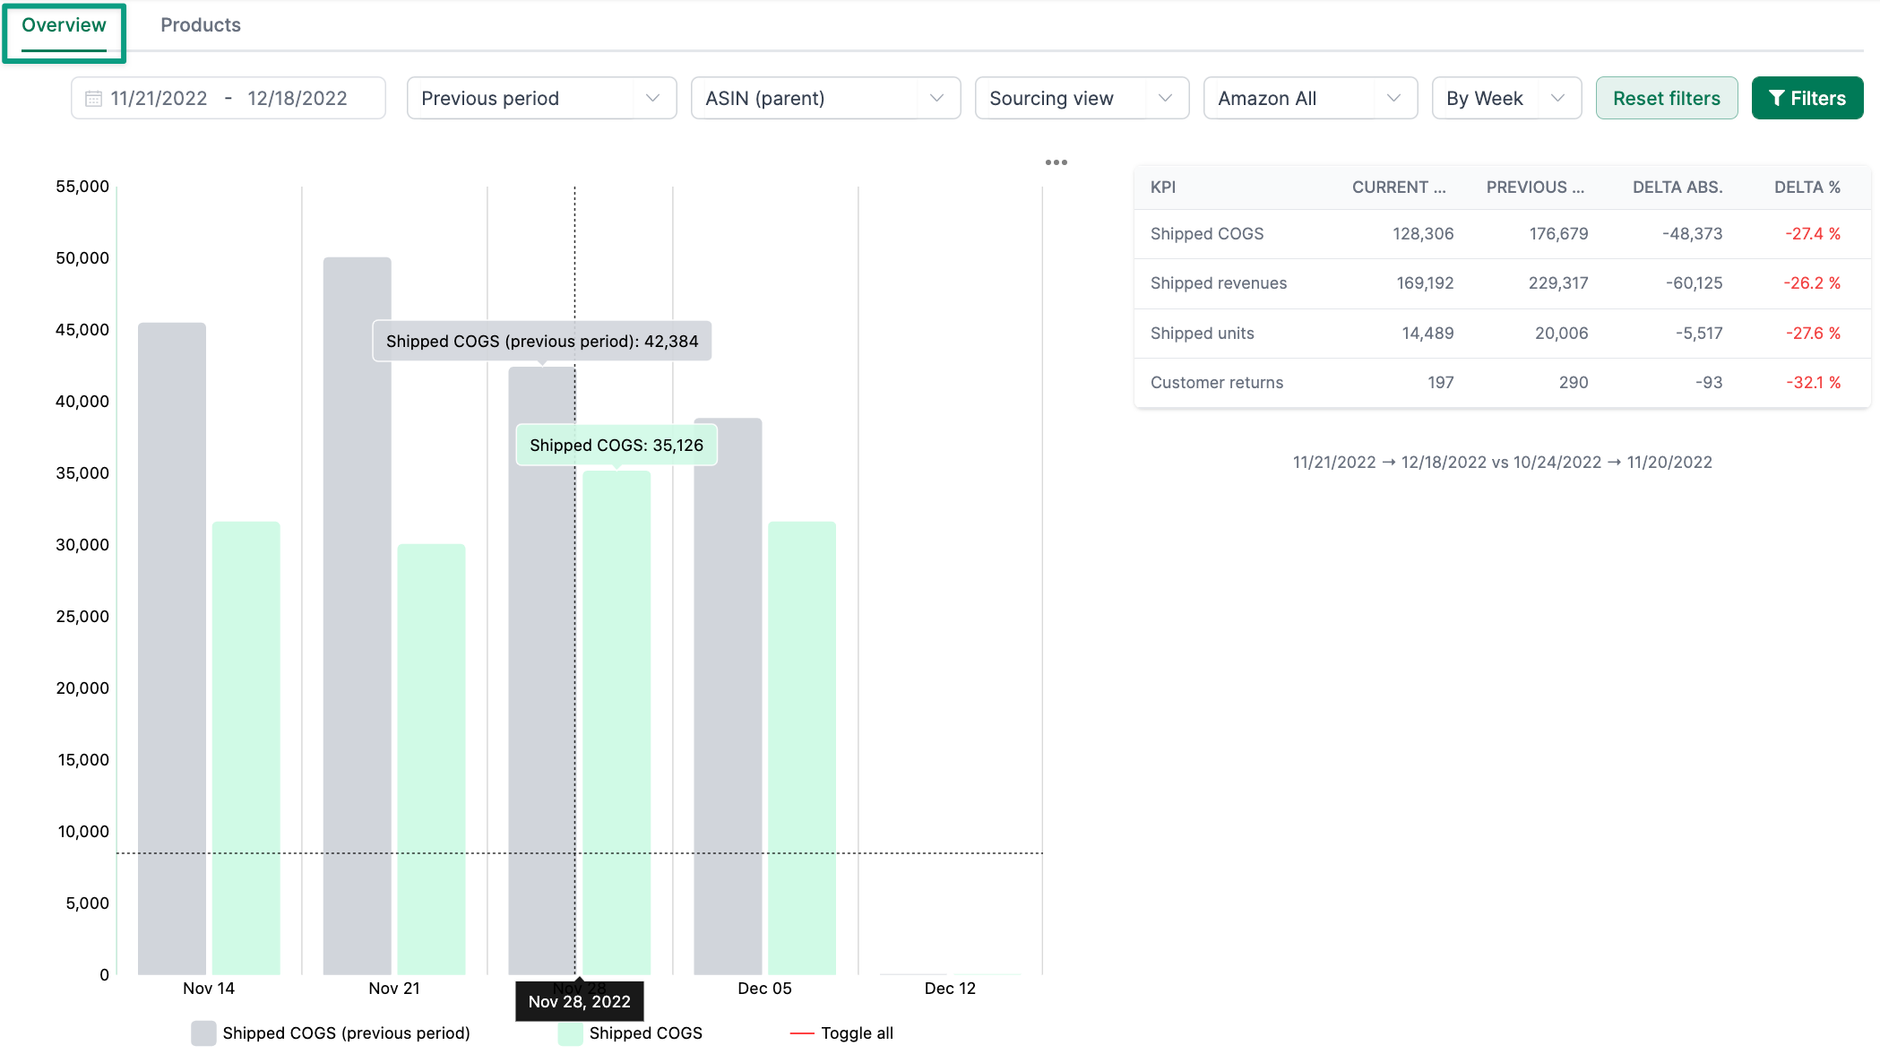
The chart shows the time course of a selected KPI within a certain period. In the filter settings, you can change the critical figure under KPI.
In the table, you can compare the following key figures with the values from the previous period:
- Shipped COGS: CoGS is the cost of shipped goods incurred by Amazon when purchasing the item from the Vendor.
- Shipped revenues: The Shipped Revenue is the revenue that Amazon makes with your products. It is based on Amazon's selling price to the customer, and the time the product was shipped to the customer.
- Shipped units: The units shipped are the number of product units shipped to Amazon customers.
- Customer returns: Goods returned by customers are the number of units produced by customers.
In the chart and the table, we show the current value and the value of the previous period. In addition, you can see the absolute and relative changes in the values.
Period comparison (detail)
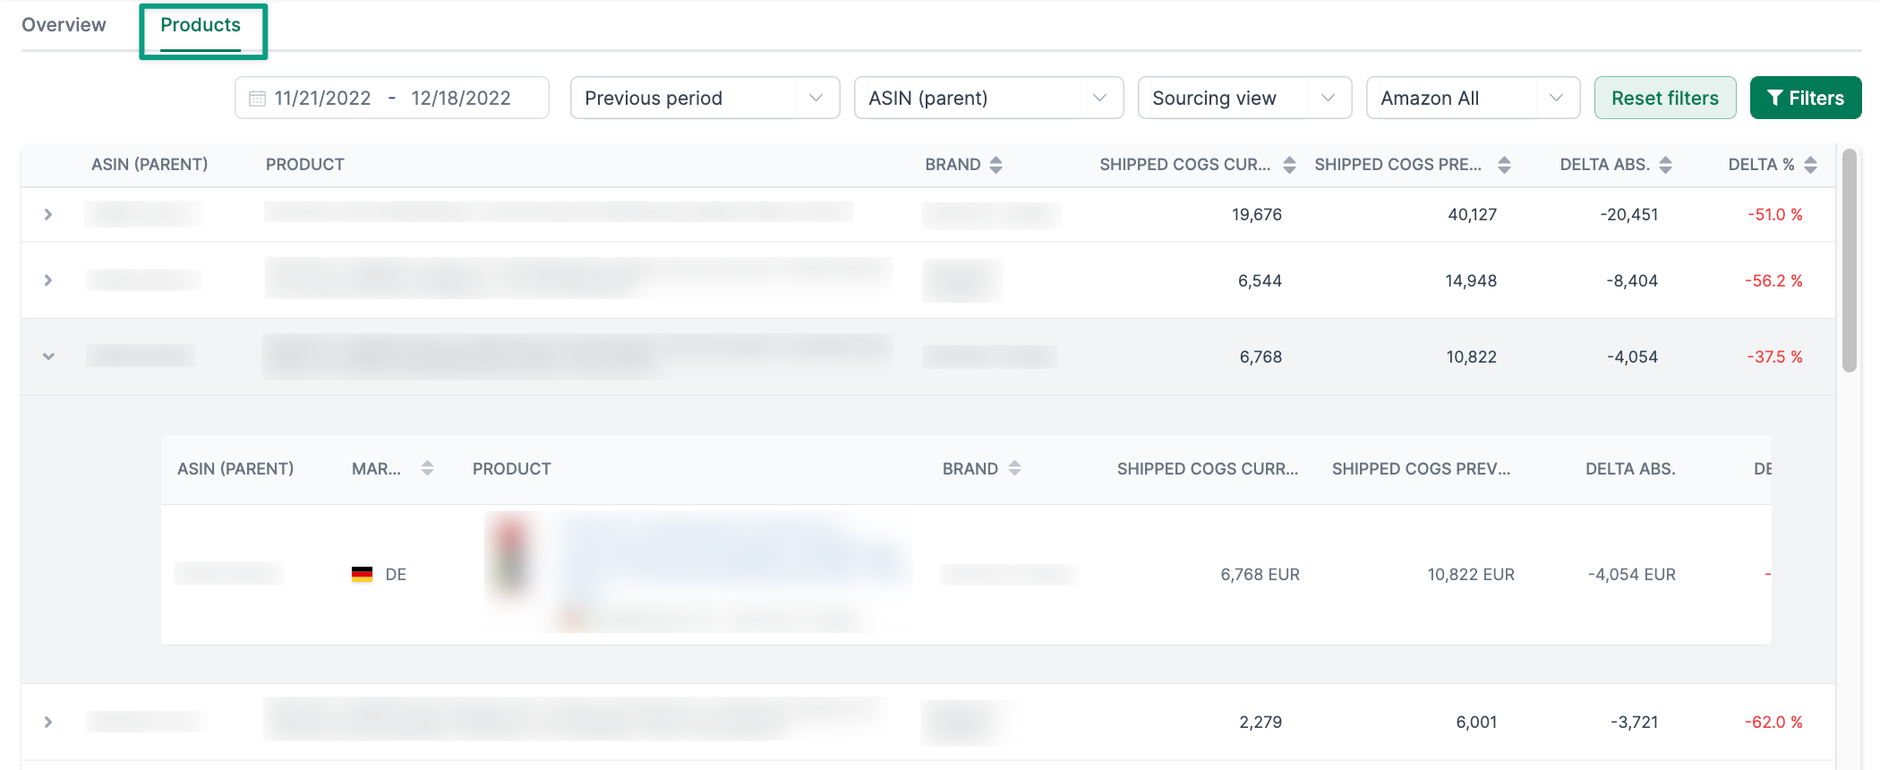
If you click on the Products tab next to Overview, you will find a breakdown:
- Child-ASIN
- Parent-ASIN
- Brand
- Category
- Market
Click on the arrow in the table on the left to analyze in more detail. For example, you can see the child ASIN of the parent ASIN or the products per brand.
In the table you will find the following key figures:
- ASIN / Brand / Category / Marketplace: what is shown to you in the first column depends on what you want to filter for or analyze.
- Marketplace
- Product: here, you can see the main picture and the ASIN of the product
- Brand
The following two columns depend on whether you are in the sourcing view or manufacturing view. You can change the view via the filter.
- Value of units shipped current ( sourcing view): the metric describes the revenue based on the cost of goods sold. It refers to costs incurred by Amazon when purchasing the item from the vendor. In this column, you can see the value of the current period.
- Value of shipped units previous period (sourcing view): In this column, you can see the last period's value.
- Order sales current ( manufacturing view): the critical figure indicates the ordered product sales in a selected period. In this column, you can see the value of the current period.
- Order sales previous period (production view): You can see the last period's value in this column.
- Delta absolute: here, you see the fundamental difference between the periods.
- Delta relative: here, you can see the percentage difference between the periods.
- Details: here, you can see different KPIs, e.g., for your product.
Filter options
You can make the following filter settings:
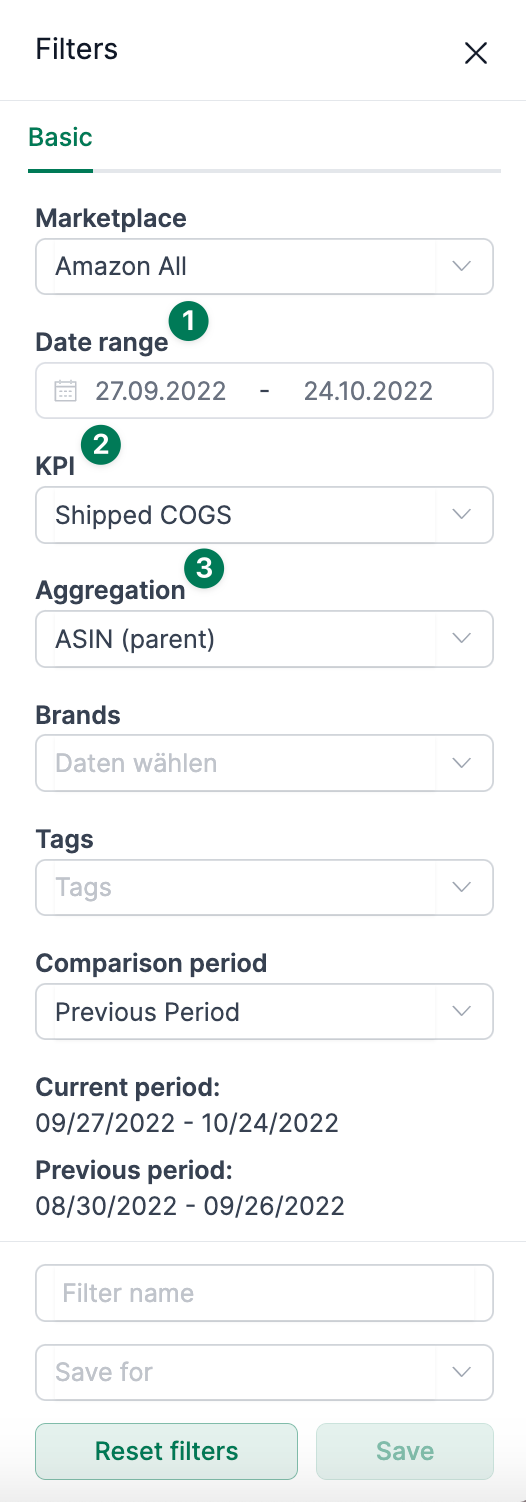
- Set the period you want to view. By default, the last 28 days are set. However, you also can compare, for example, the month of October this year with October last year.
- Select the critical figure you are interested in. On the overview page, the chart also adjusts.
- Select the aggregation level based on which you want to aggregate the metric.