Amazon Search Query Performance Report: Complete Guide
Trutz Fries
In October 2022, Amazon introduced the Search Query Performance Report in Brand Analytics.
With this report, sellers finally have access to first-party Amazon data on customers’ search, click, and purchase behavior. All the more reason to take a closer look at this report.
The “Search Query Performance” report enables sellers to better understand customer search behavior. The data provides insights into the so-called search funnel. The search funnel describes the process ranging from first impressions, clicks, to products added to the shopping cart, and finally purchases. For example, you can see how often a search term was entered in the Amazon search bar in a given time period or the number of ASINs that customers clicked on in the search results. In addition, you can see how your brand is performing compared to all the rest of your competitors.
In this article, we will show you what information the report contains and how to draw the right conclusions from it.
What information does the “Search Query Performance” report provide?
To access the Search Query Performance Report, click on “Brand Analysis” in Seller Central, then on “Search Analysis” and finally on “Search Query Performance”.
In the report, just like anywhere else in Brand Analytics, you have to select the respective marketplace, e.g. the UK. By default, the USA are often selected here, even if you are logged into a German seller account. Therefore, the first step is to adjust the marketplace using the drop-down menu in the upper right corner (1).
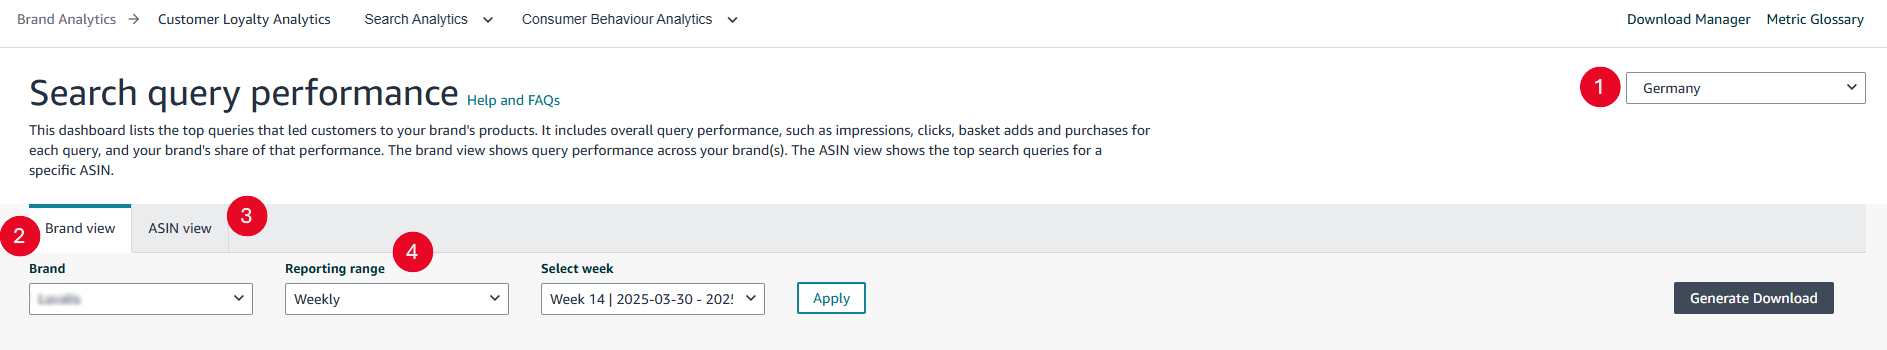
You can also filter by brand in the brand view (2), by ASIN in the ASIN view (3) and by the reporting range/period (4). You can set the reporting range to “weekly”, “monthly” and “quarterly”. The selected time period can be crucial for the search queries, for example to recognize seasonal changes. As of April 2025, you can access data up to December 2023.
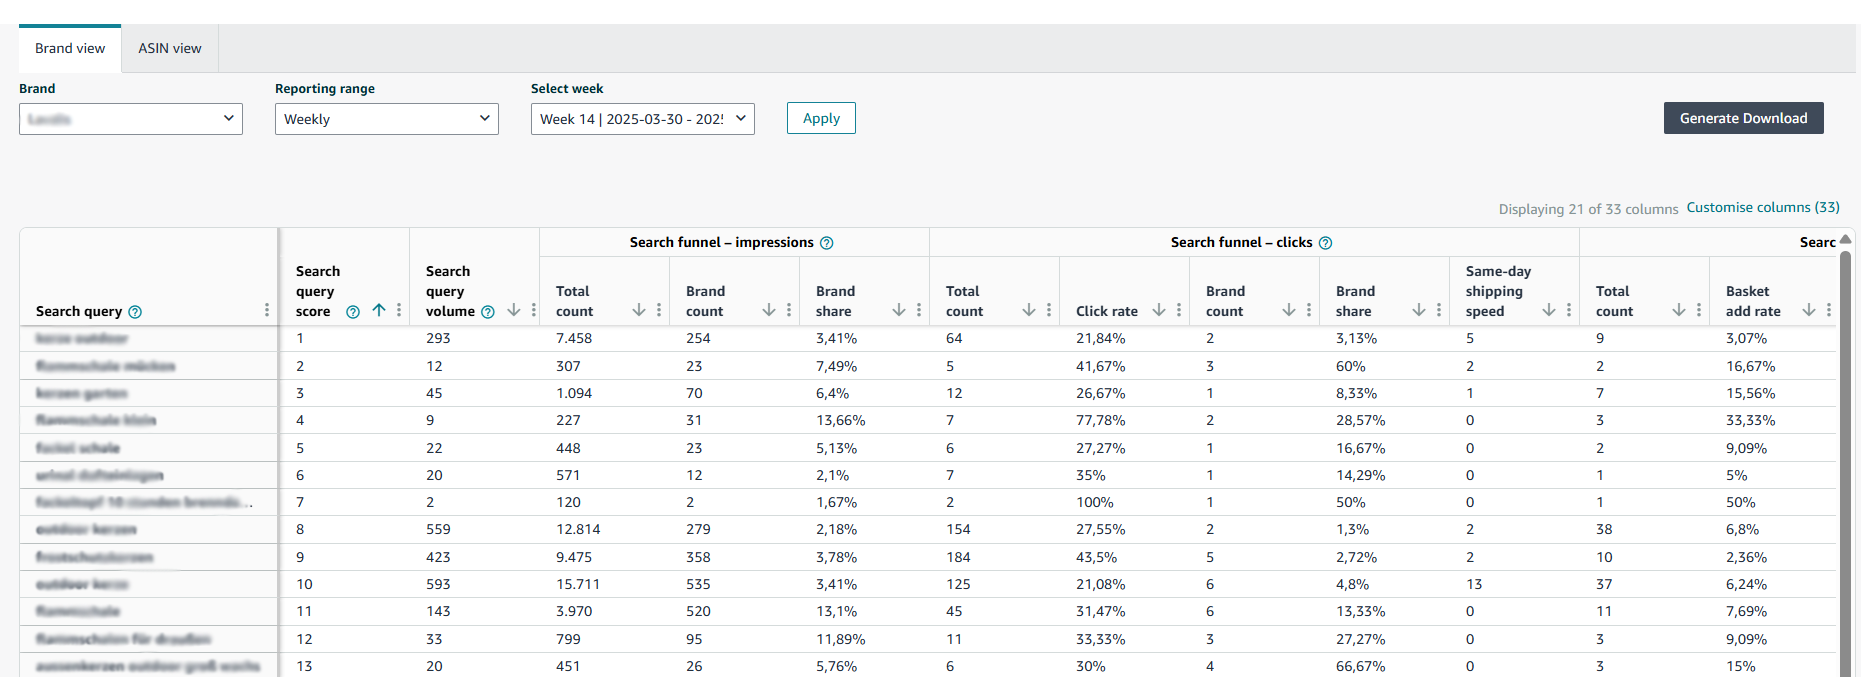
After you have set the filters, the data is displayed directly on the page.
In the resulting table, you will see the top search queries based on the filter criteria, sorted in descending order by the importance of the search query. According to Amazon, the rank is calculated through a combination of the performance of impressions, clicks, purchases and brand or ASIN performance. For each search query, you will receive different key figures from Amazon, which we will discuss below.
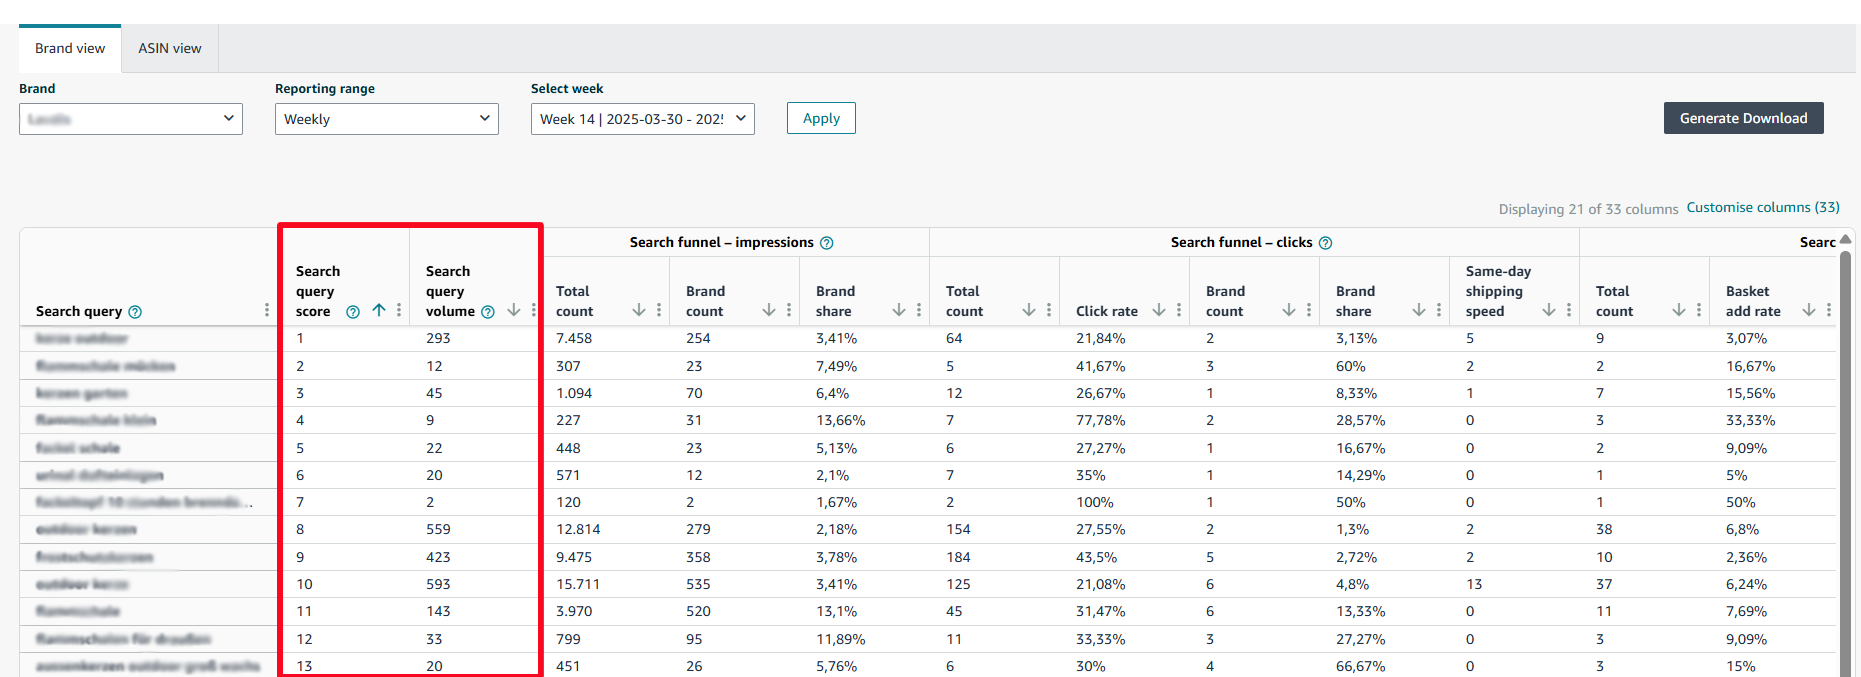
The first column “Search Query Score” sorts the 1,000 top-rated queries from highest to lowest performance. The “Search Query Volume” describes how often the search query was searched for in a given period. In our example, you can see that the first search term was entered 293 times in the search bar by Amazon customers in the 14th calendar week.
Below you will find key figures for the individual steps of the search funnel:
- Impressions
- Clicks
- Basket Adds
- Purchases
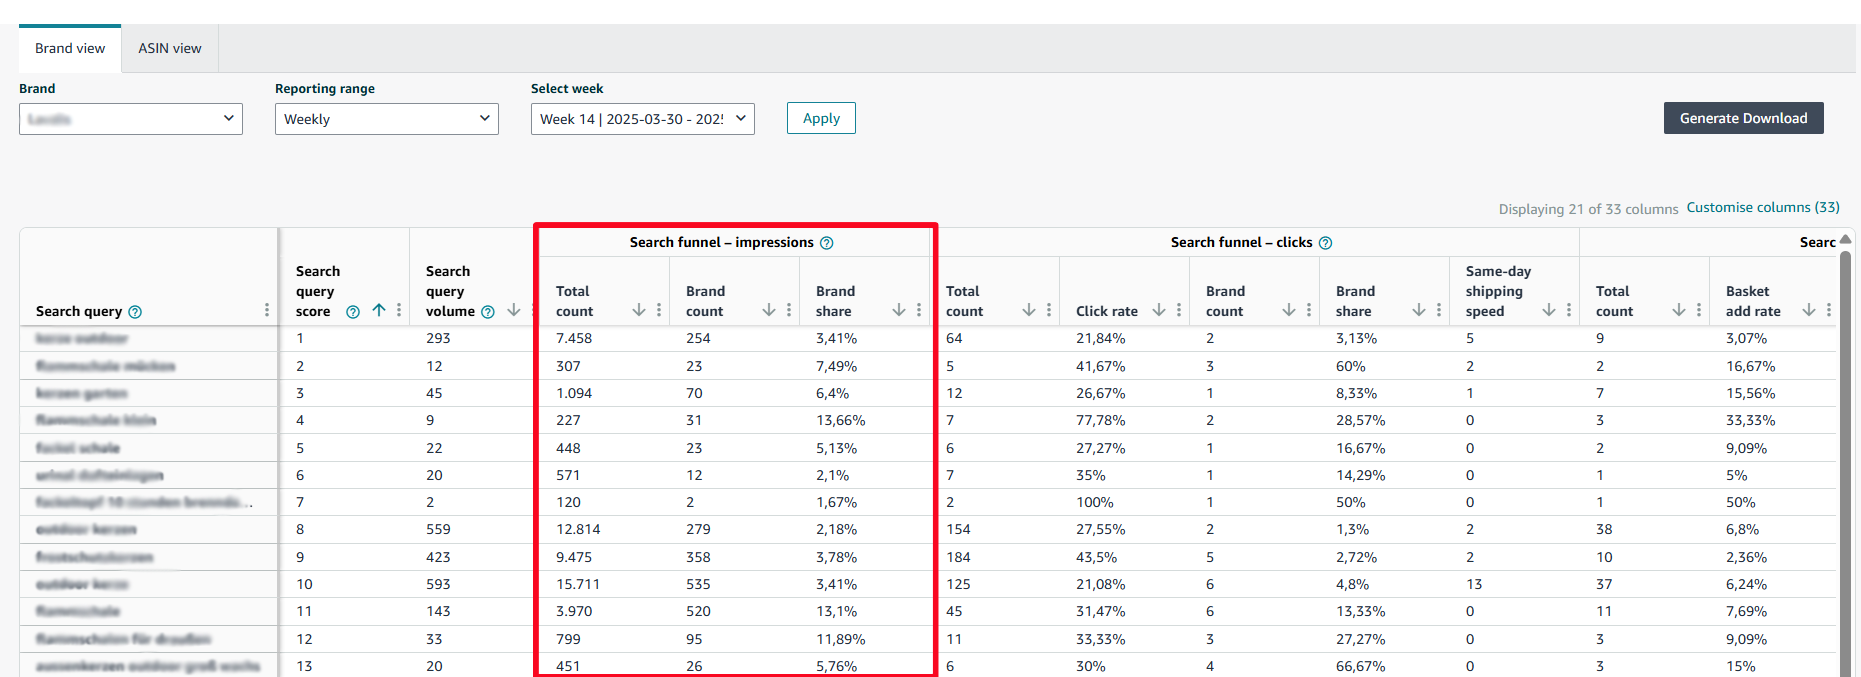
Impressions
-
Total Count: Here you can see the number of ASINs that customers have seen in the search results. In general, the number is greater than the number of search queries, since a customer can see several ASINs in the search results for a single search term.
-
Brand Count: Here you can see the number of ASINs of your own brand that customers have seen in the search results. Of a total of 7458 impressions, 254 products of the brand were displayed.
-
Brand Share: This shows you what share of impressions can be attributed to your brand (formula: number of brands / total number of impressions).
It makes sense to monitor these key figures over time and to analyze whether the brand share is increasing or decreasing. Please note that the key figures do not provide any information about your ranking within the search results. It makes a big difference whether your products are at the top or bottom of the search results’ first page. If the rank of your products in the search results changes, sales will likely increase or decrease. However, the number of the impressions will not change.
Clicks
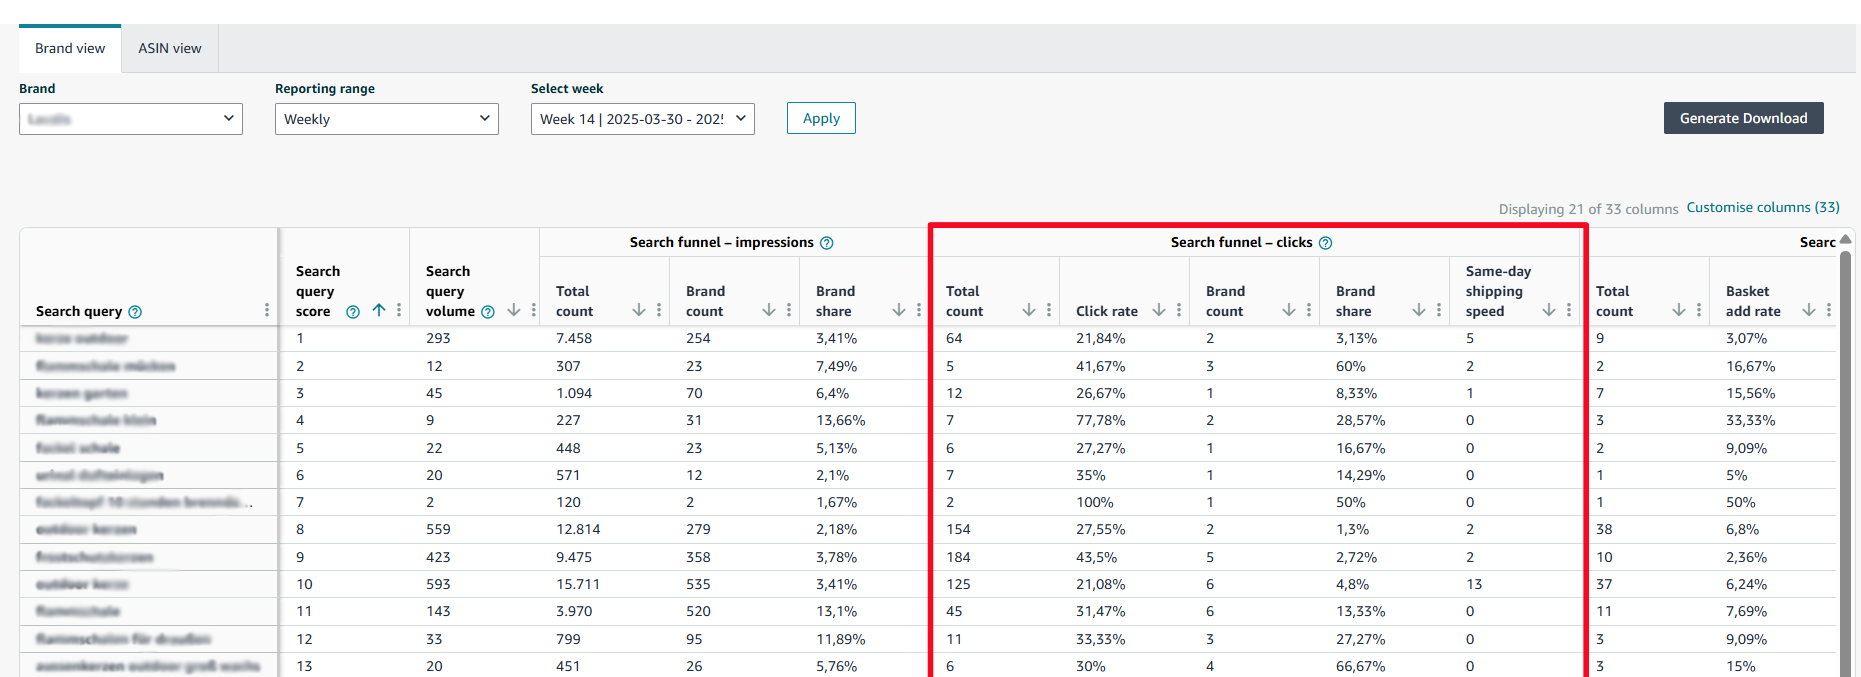
- Total Count: This is the number of ASINs that customers clicked on within their search results. In our example, 64 products were clicked on after customers searched for the first search term.
- Click Rate: This is the number of clicks against the number of searches (formula: total number of clicks / search query volume). The lower the click-through rate, the less the product matches the search query.
- Brand Count: Here you can see the number of ASINs from your own brand that customers clicked on in the search results. In the example, two products from the brand were clicked on in calendar week 14 of 2025.
- Brand Share: Here you can see what proportion of clicks can be attributed to your brand (formula: number of brands / total number of clicks). Approximately one in ten people who clicked on a product also clicked on a product from the brand.
- Same-Day Shipping Speed: The key figure shows how often an ASIN was displayed on the search results page with the message “Same-day delivery”.
Basket Adds
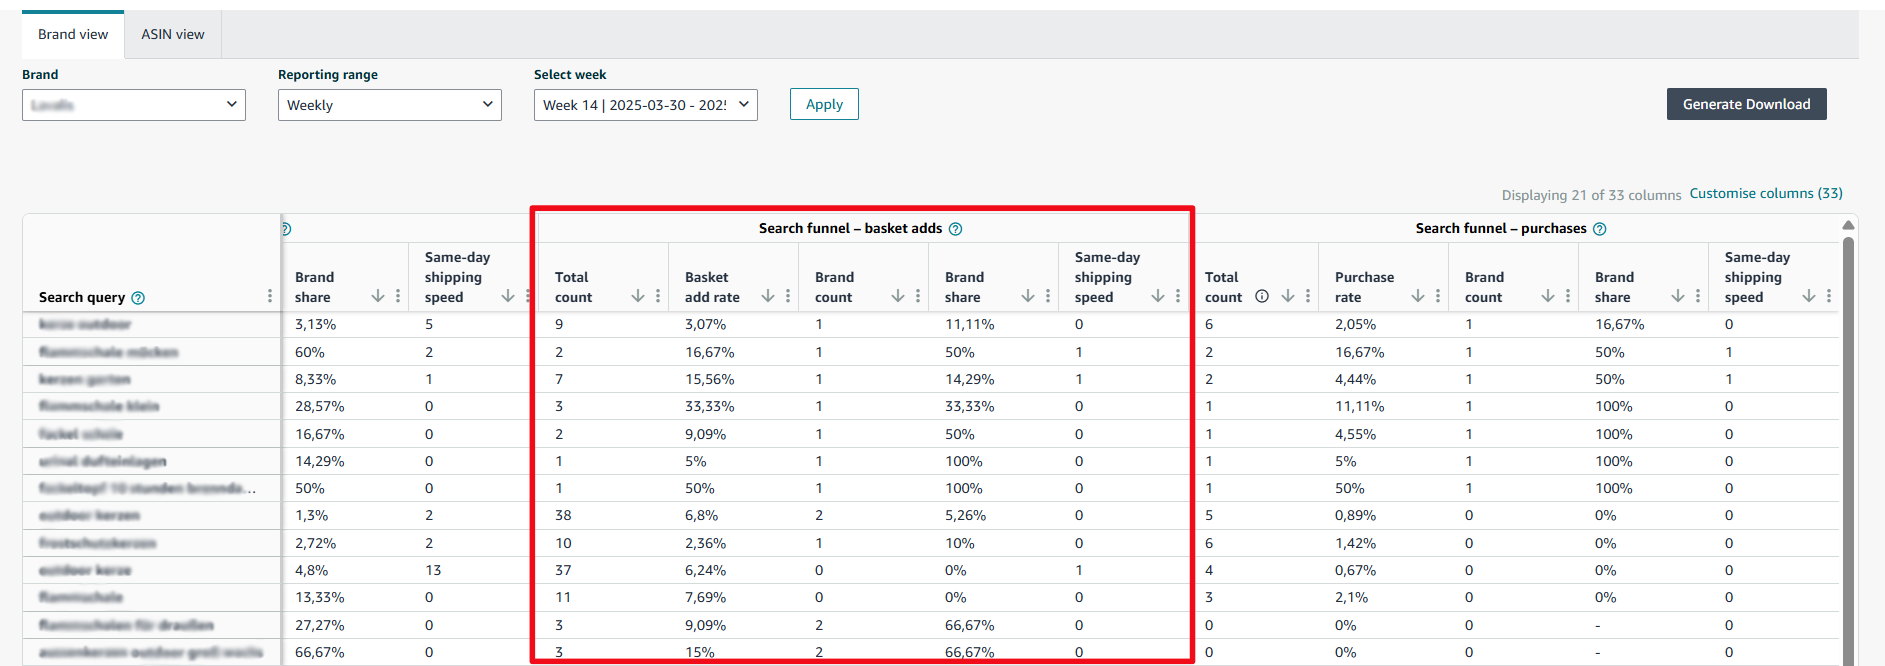
- Total Count: This is the number of ASINs that customers have added to their shopping cart. In our example, 9 out of 64 clicked ASINs were added to the shopping cart.
- Basket Add Rate: Here you can see what proportion of the search query volume was actually added to the shopping cart (formula: total count / search query volume).
- Brand Count: Here you can see the number of ASINs of your own brand that customers have added to the shopping cart. In the example, 1 product of the brand was added to the shopping cart out of 9 products (total).
- Brand Share: This shows you what proportion of the products added to the shopping cart can be traced back to ASINs of your own brand. (Formula: number of brands / total count).
- Same-Day Shipping Speed: This key figure shows how often an ASIN was displayed on the search results page with the message “Same-day delivery”.
Purchases
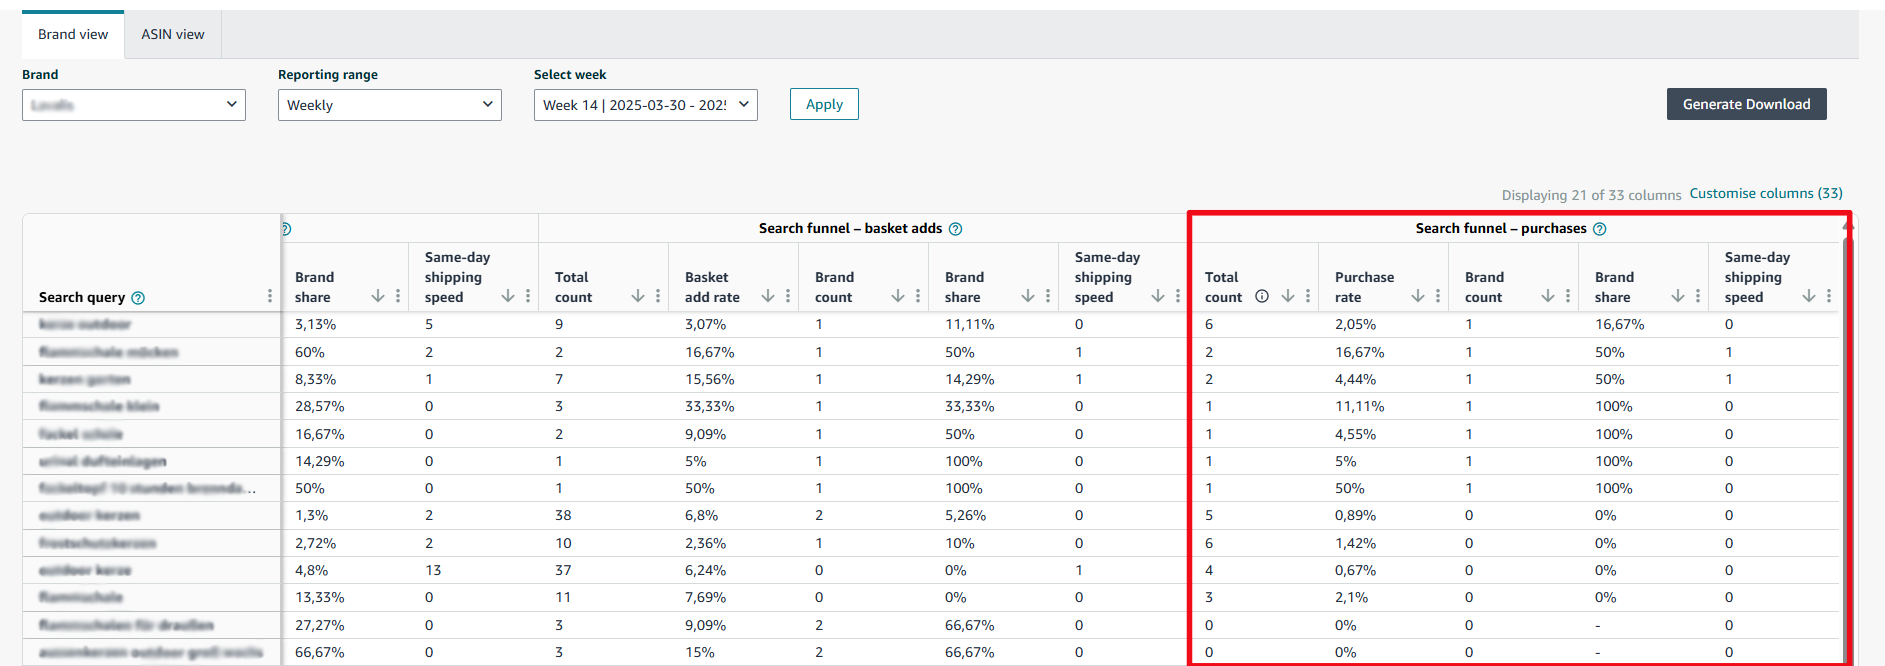
- Total Count: This is the number of ASINs that were actually purchased.
- Purchase Rate: This shows you what proportion of the search results were purchased. (Formula: total number of purchases / volume of the search query).
- Brand Count: This shows you the number of ASINs of your own brand that customers have purchased. In the example, 6 products were purchased, 1 of which was from the brand in question.
- Brand Share: This shows you what share of the purchases can be attributed to your brand (formula: number of brands / total number of purchases).
- Same-Day Shipping Speed: This key figure shows how often an ASIN was displayed on the search results page with the message “Same-day delivery”.
Please note that the total count of sales may not match the total number of sales from your sales reports. This is because the sales figures in the report only refer to sales that originated from the search results.
The metrics in the ASIN View are ultimately the same as in the brand view. Let’s take a look at the metrics for clicks in the ASIN view as an example.
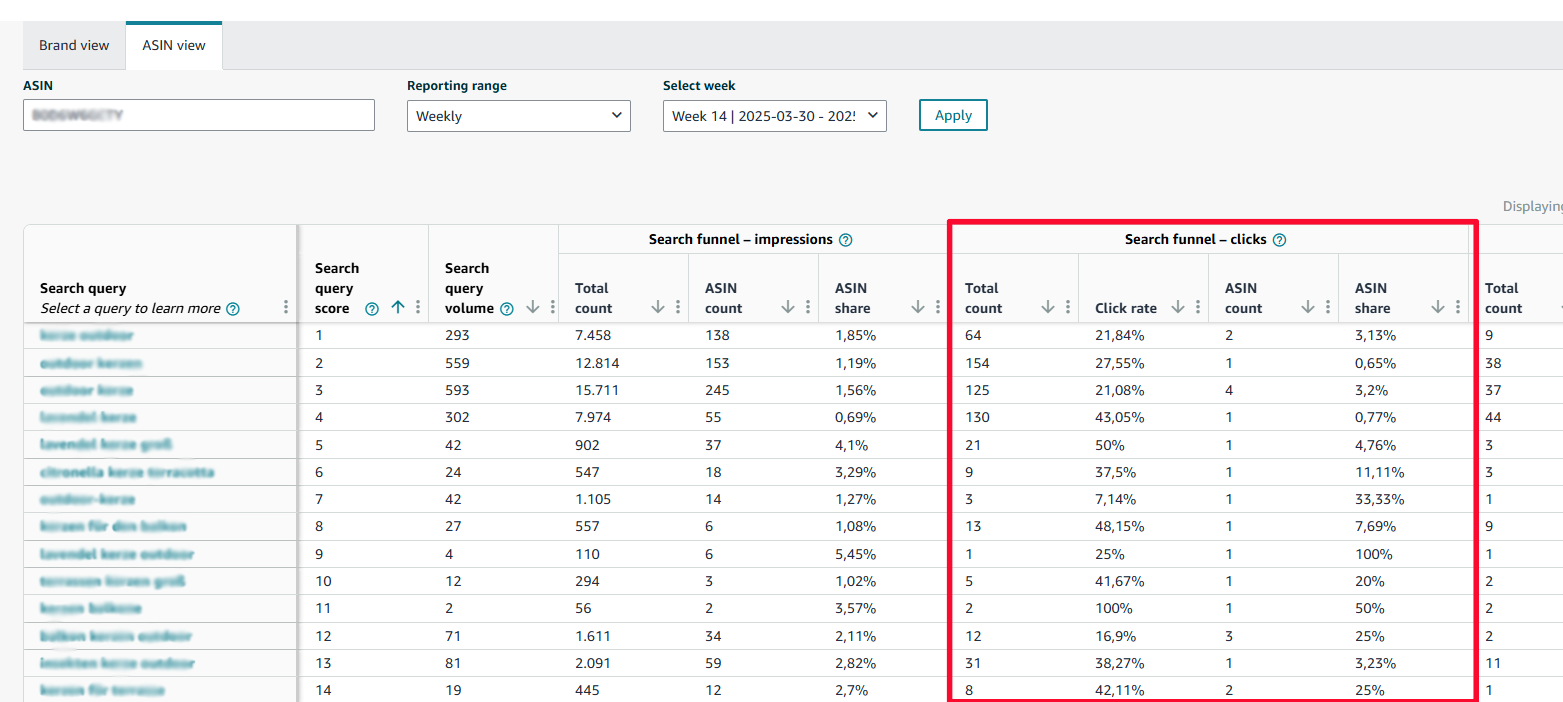
Under the “Total Count (Clicks)” you can see the number of ASINs that customers clicked on in the search results. The “Click Rate” is calculated as in the brand view with the formula: Total number of clicks / volume of the search query. Instead of the metric “Brand Count” you will now see the metric “ASIN Count”. The metric “Brand Count” describes the number of ASINs of your own brand that customers have clicked on. It is possible that a customer has clicked on two different ASINs of your brand in the search results. In contrast, the metric “ASIN Share” refers to only one specific product. The “ASIN Share” is calculated in the same way as the “Brand Share” using the formula: ASIN count/ total number of clicks.
How can I analyze this report?
We have built a simple micro-tool that allows you to easily evaluate the report at brand level. First, download your report in Seller Central as a CSV file and then upload it to our free tool.
You can find more information about this tool on the tool page.
If you are interested in more comprehensive information and deeper insights into the Search Query Performance Report, AMALYTIX offers effective support with its new analysis extensions.
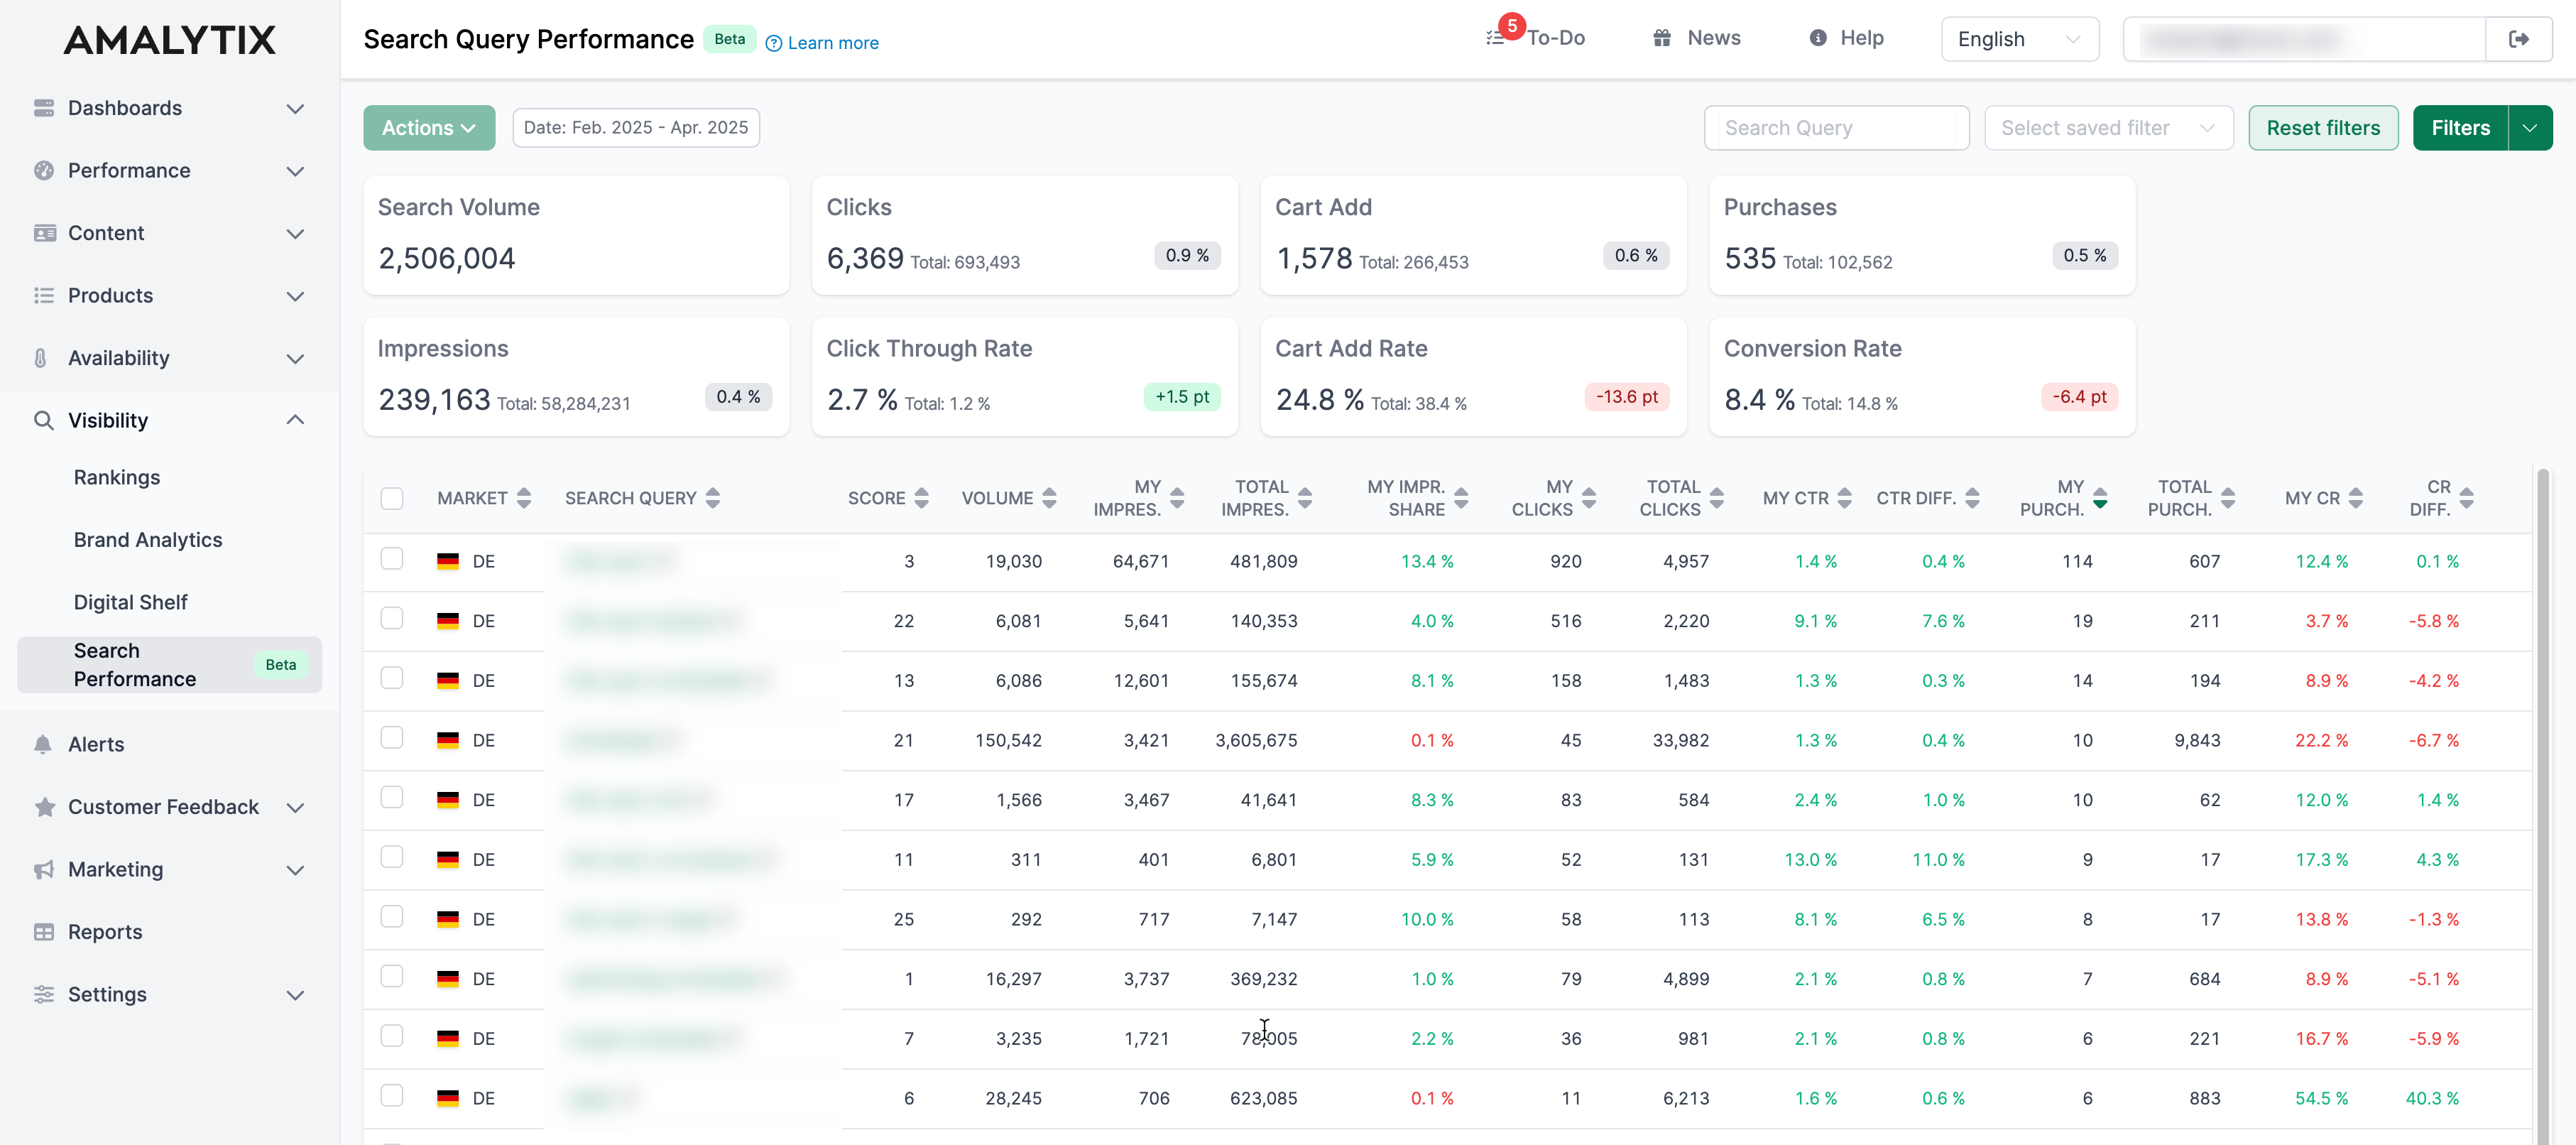
Our extensions allows you to display aggregated key figures such as clicks and conversions clearly over freely selectable periods of time – ideal for identifying seasonal fluctuations or long-term trends. Thanks to precise filter options i.e. by brand and by multiple ASINs (instead of just one as in Seller Central), you can analyze your data in a targeted manner. In addition, historical data can be accumulated and compared over longer periods of time – a clear advantage for strategic decisions. With AMALYTIX, you not only keep your overview, but also gain real competitive advantages.
How can I use the Search Query Performance Report?
You can use the Search Query Performance Report in a variety of ways. The main ways to use it are:
Analysis
The “Search Query Performance” report contains information that helps you determine how your brand or individual ASINs appear in search queries. The “Brand Share”, which indicates what percentage of total impressions, clicks, basket adds, or purchases your brand receives out of the total for that search term, is particularly useful. This insight underlines the importance of your brand and helps you understand how much market share is captured by competitors. Track brand share over time to evaluate the development of your brand. The report provides you with powerful keywords that can be valuable for adjusting your marketing and Amazon strategy.
Listing Optimization
Since the search queries for your brand are most relevant, you should make sure that they are used in your offers. This will have a positive effect on your SEO and on your organic ranking. But you can go into even more detail. If you notice a low conversion rate, it is worth checking whether the problem is that few customers add the product to their shopping cart or whether a high percentage of customers do not buy the product. If, for example, only a few products are added to the shopping cart, it might help to add more information or images on the product detail page (/wissen/seo/amazon-produktbilder/). If many customers add the product to their shopping cart but only a few make a purchase, you could consider lowering the price or offering a voucher.
Advertising
In addition to the product detail page, you should also include the search queries in your advertising campaigns. But first analyze the search queries. Pay attention to search queries that generate many impressions but few clicks / basket-adds / purchases. You should place none or only low bids on such keywords because they do not match your product well.
On the other hand, you should identify attractive keywords and include them in your product listings to generate more impressions (and possibly more clicks and purchases). If you notice that your conversion rate is high for some search terms, but that these purchases only take place within a few impressions, you should use ads to push these terms in order to increase your sales through increased visibility.
To complement this report, vendors should also leverage Amazon Retail Analytics (ARA) for comprehensive sales and inventory insights.
Conclusion
The most important advantage of the search query report is that sellers finally get first-party data from Amazon. Previously, it was difficult to get data on search queries. Now, Amazon sellers can access key figures on their advertising campaigns in the Advertising Console in the Search Terms Report and on paid and organic search data in the Search Query Performance Report. In addition, sellers can access metrics on products at the ASIN level within the Search Catalog Performance Report section. We have summarized the most important advantages and disadvantages of these reports:
Search Query Performance Report
The Search Query Performance Report shows detailed data on impressions, clicks, basket adds and purchases – at both brand and ASIN level. It includes organic and paid search queries and is available retroactively to 2023 on a weekly, monthly, or quarterly basis. The disadvantage is that only search terms for your own brand are included. In addition, the report does not show which search terms products do not appear for, and at the ASIN level it only allows the analysis of single products.
Search Terms Report
The Search Terms Report provides an overview of all search terms on the marketplace. It shows the top three ASINs per term by clicks and revenue share and can also be used retroactively until 2023. However, it only shows the three strongest products per search term and only considers advertising search queries – organic data is completely missing.
Search Catalog Performance Report
The Search Catalog Report provides ASIN-based metrics such as impressions, clicks, conversion rates and sales. It can also be analyzed back to 2023 and is well suited for product evaluation. However, it lacks any data on search terms or competing products. It is therefore not suitable for keyword research or market comparisons.
Q&A
How can I view this data myself in Seller Central?
Log in to Seller Central, navigate to the “Brand Analytics” section and select the “Search Analytics” menu item. You will find all three reports mentioned above there. You can then filter the report by time period, market and brand and either display it directly in the browser or export it as a CSV file. Would you like to learn more about Seller Central? Our comprehensive article will help you.
How can I use the insights into search queries and keywords for my listing optimization?
The Search Query Performance Report helps you to identify relevant, high-performing search terms and integrate them into your title, bullet points, and backend keywords. Search terms with high impressions but low conversion also offer optimization potential, e.g. through better product presentation or pricing. In addition, new keyword opportunities and competitive comparisons can be derived to improve your listing and develop long-term SEO strategies. If you want to delve deeper into the topic of keywords, we have here a more comprehensive article for you.
Can AI help me evaluate data and implement new strategies?
Yes, AI can significantly help you evaluate your Amazon Search Query performance data and implement new strategies. It recognizes patterns, identifies opportunities and weaknesses at the keyword and ASIN level, and provides specific recommendations for action – faster and more accurately than would be possible manually. Tools like AMALYTIX integrate these functions directly so that you can make informed decisions and efficiently and effectively develop your Amazon strategy. Our recently published free Amazon Prompts guide provides you with various AI prompts so that you can immediately increase your sales by using AI. Also read our posts on ChatGPT and other AI tools for a more comprehensive view.
Are there any other reports that can help me optimize my Amazon business?
In addition to the Search Query Performance Report, Amazon offers two other exciting data sources: the Search Term Report and the Search Catalog Performance Report. The Search Term Report shows the actual search terms that customers used to find your products – ideal for optimizing advertising campaigns. The Search Catalog Report, on the other hand, provides a comprehensive overview of the performance of your ASINs along the entire search funnel – from impressions to conversions – and allows deep insights at the product level. Both reports can be found in the Brand Analytics section of Seller Central under the menu item “Brand Analysis” > “Search Analysis”.
Glossary
Here you will find definitions of all the key figures displayed in the Search Query Performance Report.
- Search Query: This column shows you what Amazon customers enter in the search bar.
- Search Query Score: This column ranks the top 1,000 queries from highest to lowest performance.
- Search Query Volume: This column describes how often the search query was entered by Amazon customers in the search bar during a specific period.
- Same-day Delivery Speed: This figure shows how often an ASIN was displayed on the search results page with the message “Same-day delivery”.
- 1D Delivery Speed: This shows how often an ASIN was displayed on the search results page with the message “1-day premium shipping”.
- 2D Delivery Speed: This shows how often an ASIN with the message “2-day premium delivery” was displayed on the search results page.
- Price (Median): This shows the median offer price.
- Brand Price (Median): This shows the median price across all of the Brand’s ASINs.
Search Funnel - Impressions
- Total Count: Here you can see the number of ASINs that customers have seen in the search results.
- Brand Count: Here you can see the number of ASINs of your own brand that customers have seen in the search results.
- ASIN Count: Here you can see how often a particular ASIN has been displayed in the search results.
- Brand Share: This column shows the share of impressions that can be attributed to your brand (formula: number of brands / total number of impressions).
- ASIN Share: This column shows the share of impressions that can be attributed to an ASIN (formula: ASIN count / total number of impressions).
Search Funnel / Search Funnel - Clicks / Clicks
- Total Count: Here you will find the number of ASINs that customers clicked on in the search results.
- Click Rate (CTR): Here you can see the number of clicks compared to the number of searches (formula: total number of clicks / volume of search query).
- Brand Count: The number of ASINs from your brand that customers clicked on in the search results.
- ASIN Count: The number of clicks on a specific ASIN in the search results.
- Brand Share: This metric indicates the share of clicks that can be attributed to a particular brand (formula: number of brands / total number of clicks).
- ASIN Share: This metric indicates the share of clicks that can be attributed to a particular ASIN (formula: ASIN count / total number of clicks).
Search Funnel - Basket Adds
- Total Count: Here you will find the number of ASINs that customers have added to their shopping cart.
- Basket Add Rate: This metric indicates what percentage of products clicked on were added to the shopping cart.
- Brand Count: This metric shows you the number of your own brand’s ASINs that customers have added to their shopping carts.
- ASIN Count: Here you can see how often a particular ASIN was added to the shopping cart.
- Brand Share: This key figure indicates the proportion of products added to the shopping cart that can be attributed to your own brand’s ASINs (formula: number of brands/total number).
- ASIN Share: Here you can see what share of the “additions to the shopping cart” can be attributed to a specific ASIN (formula: ASIN number / total number).
Search Funnel / Search Funnel - Purchases / Purchases
- Total Count: Here you will find the number of ASINs that were actually purchased.
- Purchase Rate: Here you can see what proportion of the search results were purchased (formula: total number of purchases / volume of search query).
- Brand Count: Here you can see the number of ASINs of your own brand that customers have purchased.
- ASIN Count: Here you can see how often a particular ASIN was purchased.
- Brand Share: This shows you what share of purchases can be attributed to your brand (formula: number of brands / total number of purchases).
- ASIN Share: This shows you what share of purchases can be attributed to a particular ASIN (formula: ASIN number / total number).
More articles you might be interested in:
Subscribe to Newsletter
Get the latest Amazon tips and updates delivered to your inbox.
We respect your privacy. Unsubscribe anytime.