Amazon Retail Analytics (ARA): Complete Vendor Guide
Trutz Fries
Amazon Retail Analytics is Amazon’s proprietary analytical tool designed for vendors. It grants you access to a diverse range of reports, each offering valuable insights. The following reports are at your disposal:
- Sales
- Real-time Sales
- Inventory
- Traffic
- Forecasting
- Net PPM
- Catalogue
These reports enable you to monitor product sales, identify page views by ASIN, and keep a close eye on your current inventory levels, among other valuable metrics. For optimal inventory management, vendors should also understand Amazon Standard Identification Numbers (ASINs) to effectively track their products.
What sets apart Amazon Brand Analytics from Amazon Retail Analytics?
In 2020, Amazon rebranded ARA as Brand Analytics. However, in August 2022, Amazon gave Amazon Retail Analytics a fresh facelift, unveiling a new dashboard along with fresh metrics.
As it stands, Amazon Retail Analytics is exclusively accessible to vendors. On the other hand, Amazon Brand Analytics continues to thrive, catering to sellers and vendors. For vendors, though, only three reports remain within Brand Analytics:
All the other reports once housed in Brand Analytics can now be found in Amazon Retail Analytics.
How do you access these reports?
To access these reports, you’ll need to start by logging into Vendor Central. Once logged in, click on the “Reports” tab and select the subcategory “Retail Analytics.” This will take you to the overview page, where you can choose from a variety of reports.
Which reports are available in Amazon Retail Analytics?
In all reports, you can click on the arrow in the column to sort the results. In the “Product title” column, results will be sorted alphabetically, while columns with numerical values will sort results from highest to lowest and vice versa upon a second click. Additionally, you can filter reports by time frame (daily, weekly, monthly, quarterly, and yearly). Click on “Show additional filters” to search for a specific ASIN. By clicking “Download,” you can save the reports as Excel or CSV files.
In the “Sales” and “Inventory” reports, there’s a distinction between “Manufacturing View” and “Sourcing View.” “Sourcing” refers to orders that Amazon fulfills exclusively from your inventory. “Manufacturing” aggregates the revenue and inventory of all items associated with your brand. This also includes orders from others selling products under your brand.
Sales Report
This report provides you with an overview of the sales performance of your ASINs. You can see how many units of an ASIN were ordered, shipped, and returned, along with the associated revenue. Additionally, it allows you to compare the product performance over time.
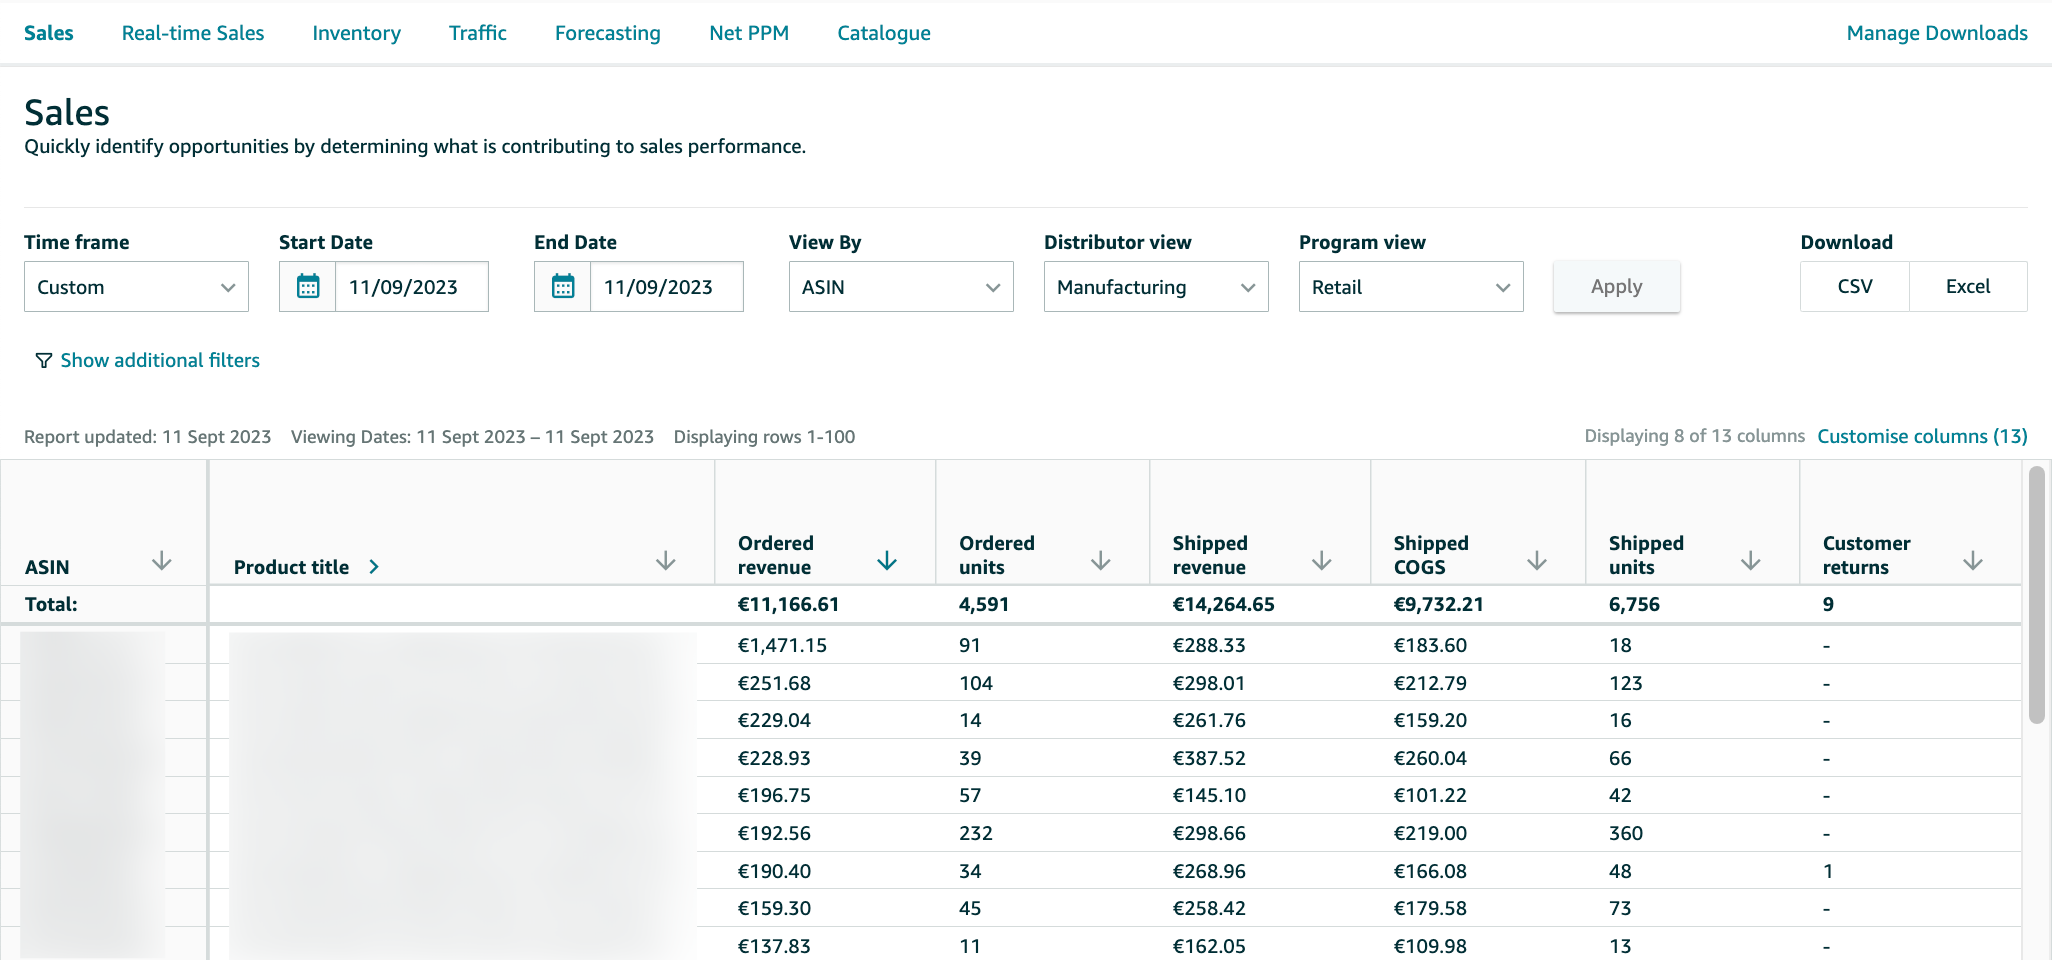
The report includes the following metrics:
- ASIN
- Product title: Here, you can see the product title of the ASIN.
- Ordered revenue: Ordered revenue represents the revenue Amazon generates from your products, even if it’s at a later time. This metric indicates the sales of products that have been ordered, including those scheduled for future shipment.
- Ordered units: This metric shows the number of ordered product units.
- Shipped revenue: Shipped revenue is the revenue generated by Amazon from your products.
- Shipped COGS (Cost of Goods Sold): Here, you can view the costs of goods sold associated with the items purchased by Amazon from vendors.
- Shipped units: This metric indicates the number of product units shipped to Amazon customers.
- Customer returns: This section displays the number of units returned by customers.
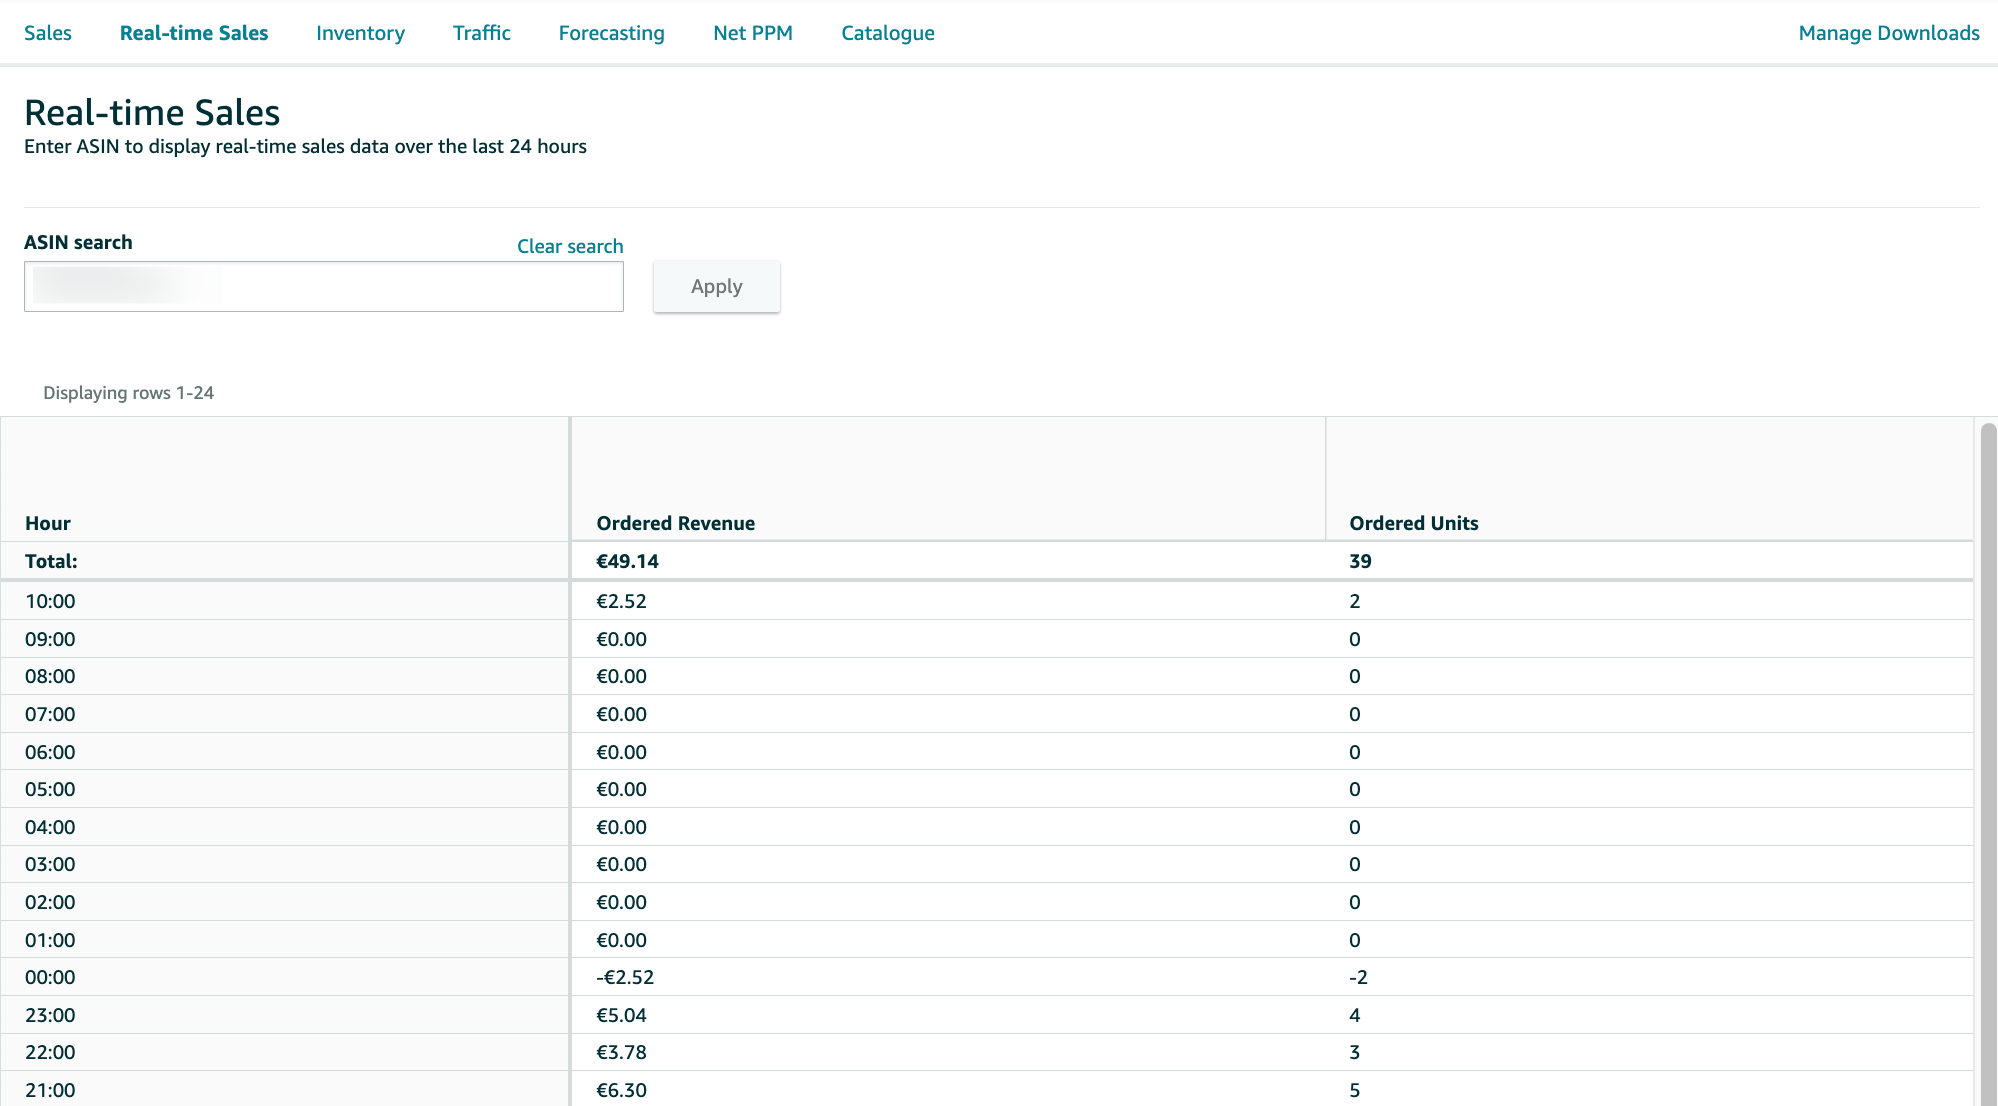
Real-time Sales
In the “Real-time Sales” report on Amazon Retail Analytics, you can track “ordered revenue” and “ordered units” on an hourly basis. This report provides a granular view of sales data in real-time, allowing you to monitor how much revenue your products are generating and how many units are being ordered hourly.
Inventory
The Inventory Report assists you in monitoring the status of your inventory at Amazon. It enables you to identify unfavorable developments and take action promptly.
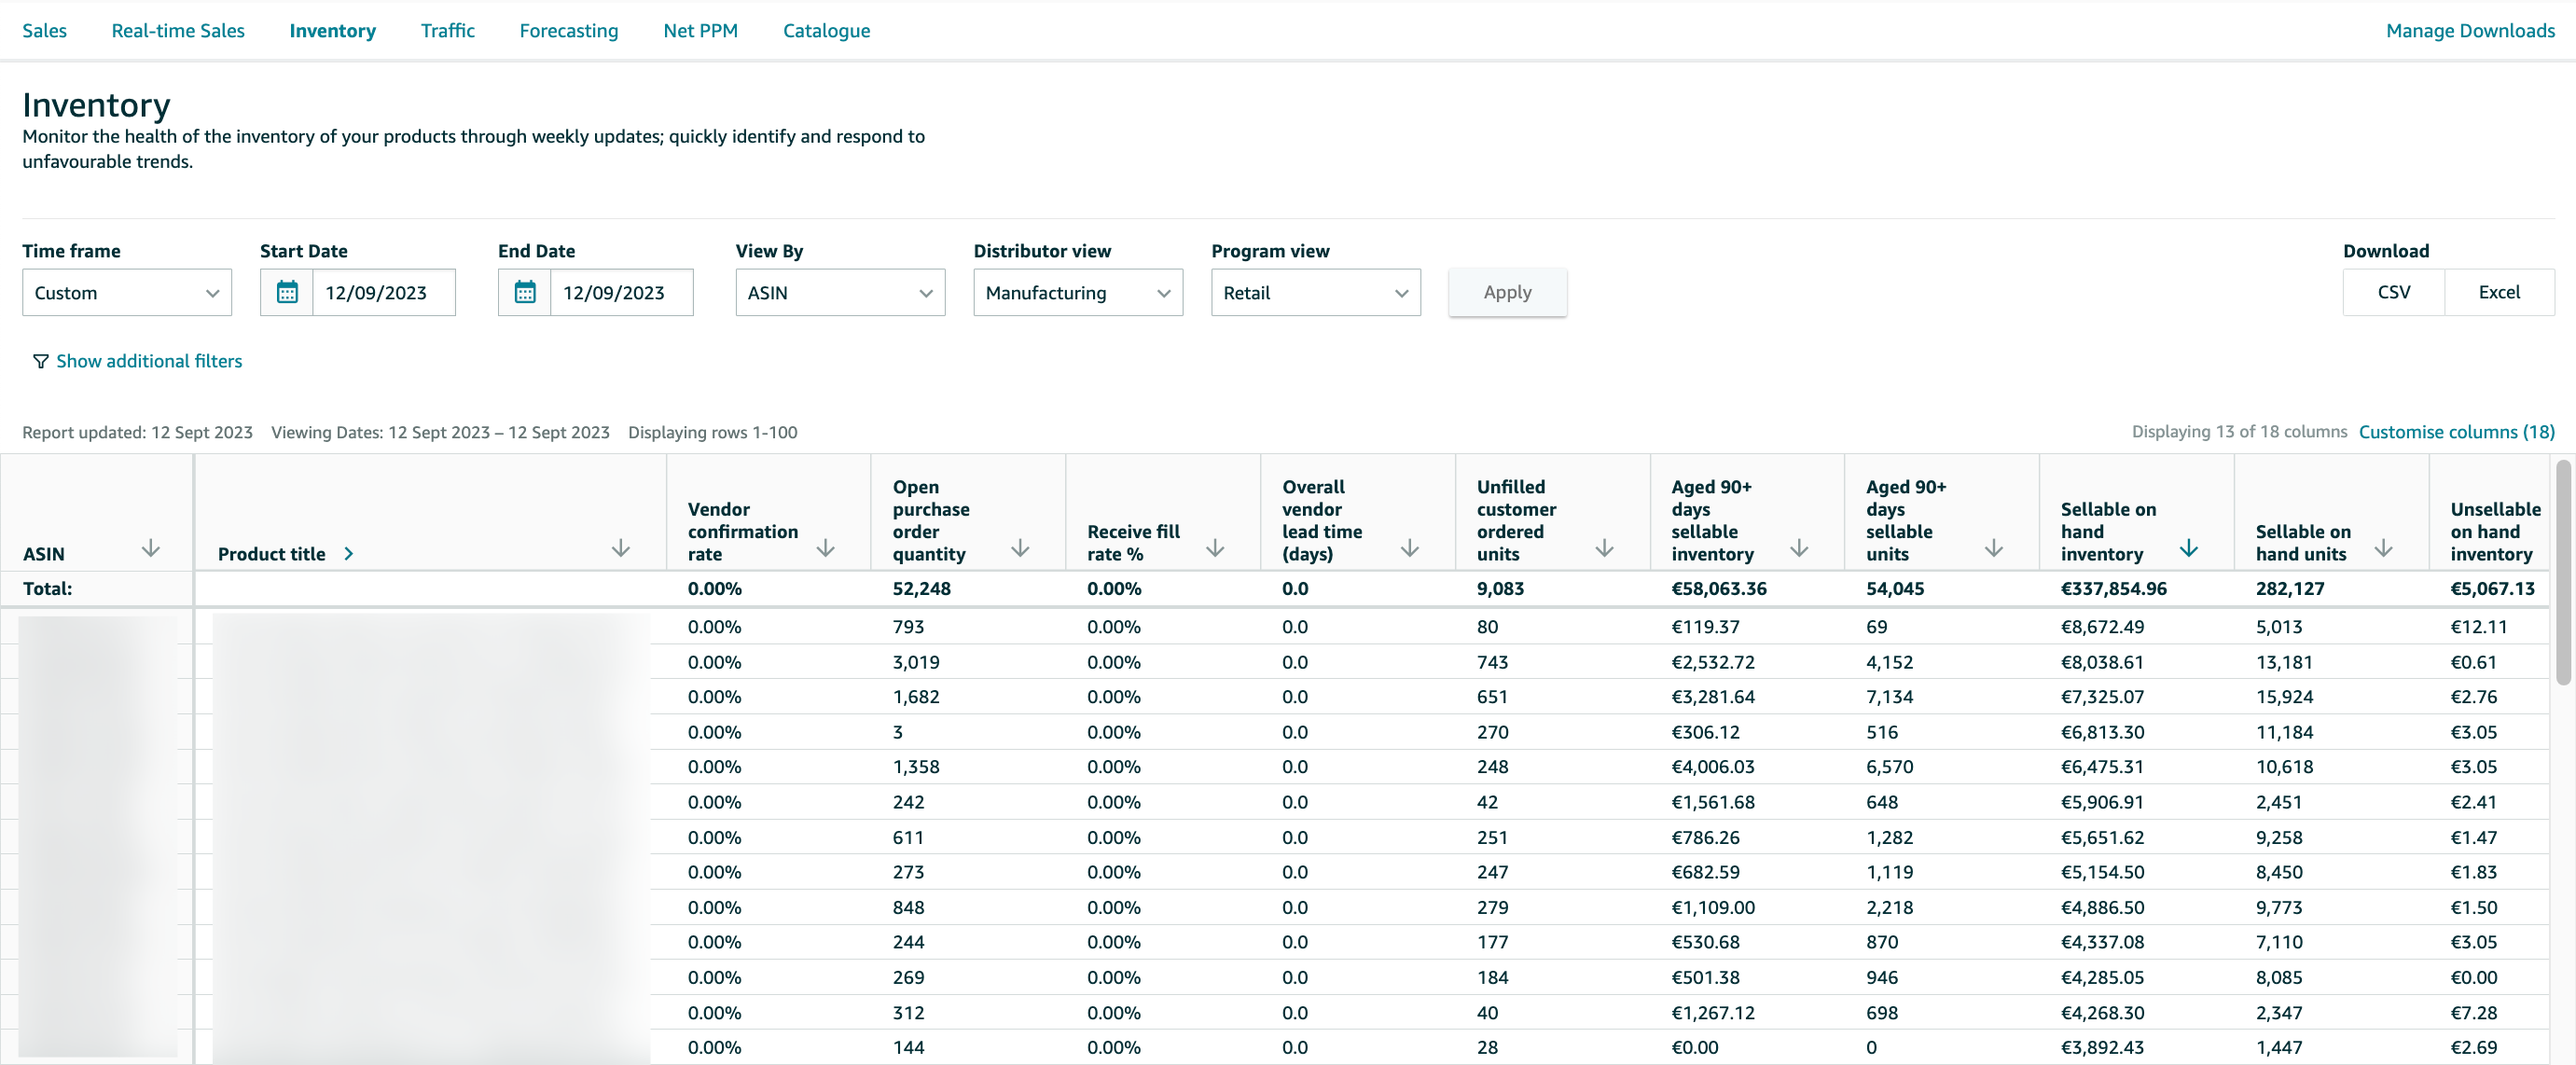
The report includes the following metrics:
- ASIN
- Product title: Here, you can view the product title of the ASIN.
- Vendor confirmation rate: This rate reflects the units requested by Amazon that have been confirmed by the vendor.
- Open purchase order quantity: This metric indicates the number of orders that the vendor has not yet fulfilled.
- Receive fill rate %: This metric relates to the ratio of ordered units to received units.
- Overall vendor lead time (days): Here, you can see the time in days from when the vendor receives the order from Amazon to when the order arrives at Amazon.
- Unfulfilled customer ordered units: This section displays the number of ordered units that have not yet been shipped.
- Aged 90+ Days Sellable Inventory: This metric shows the number of units that have been in Amazon’s inventory for at least 90 days and are in a sellable condition.
- Aged 90+ Days Sellable Units: Here, you can view the costs associated with inventory that has been in Amazon’s inventory for at least 90 days and is in a sellable condition.
- Sellable On Hand Units: This metric indicates the number of units in a sellable condition that are currently in Amazon’s inventory.
- Sellable On Hand Inventory: This metric reflects the cost of inventory consisting of sellable units in Amazon’s inventory.
- Unsellable On Hand Units: This section displays the number of units in an unsellable condition that are currently in Amazon’s inventory.
- Unsellable On Hand Inventory: Here, you can see the costs associated with inventory consisting of unsellable units in Amazon’s inventory.
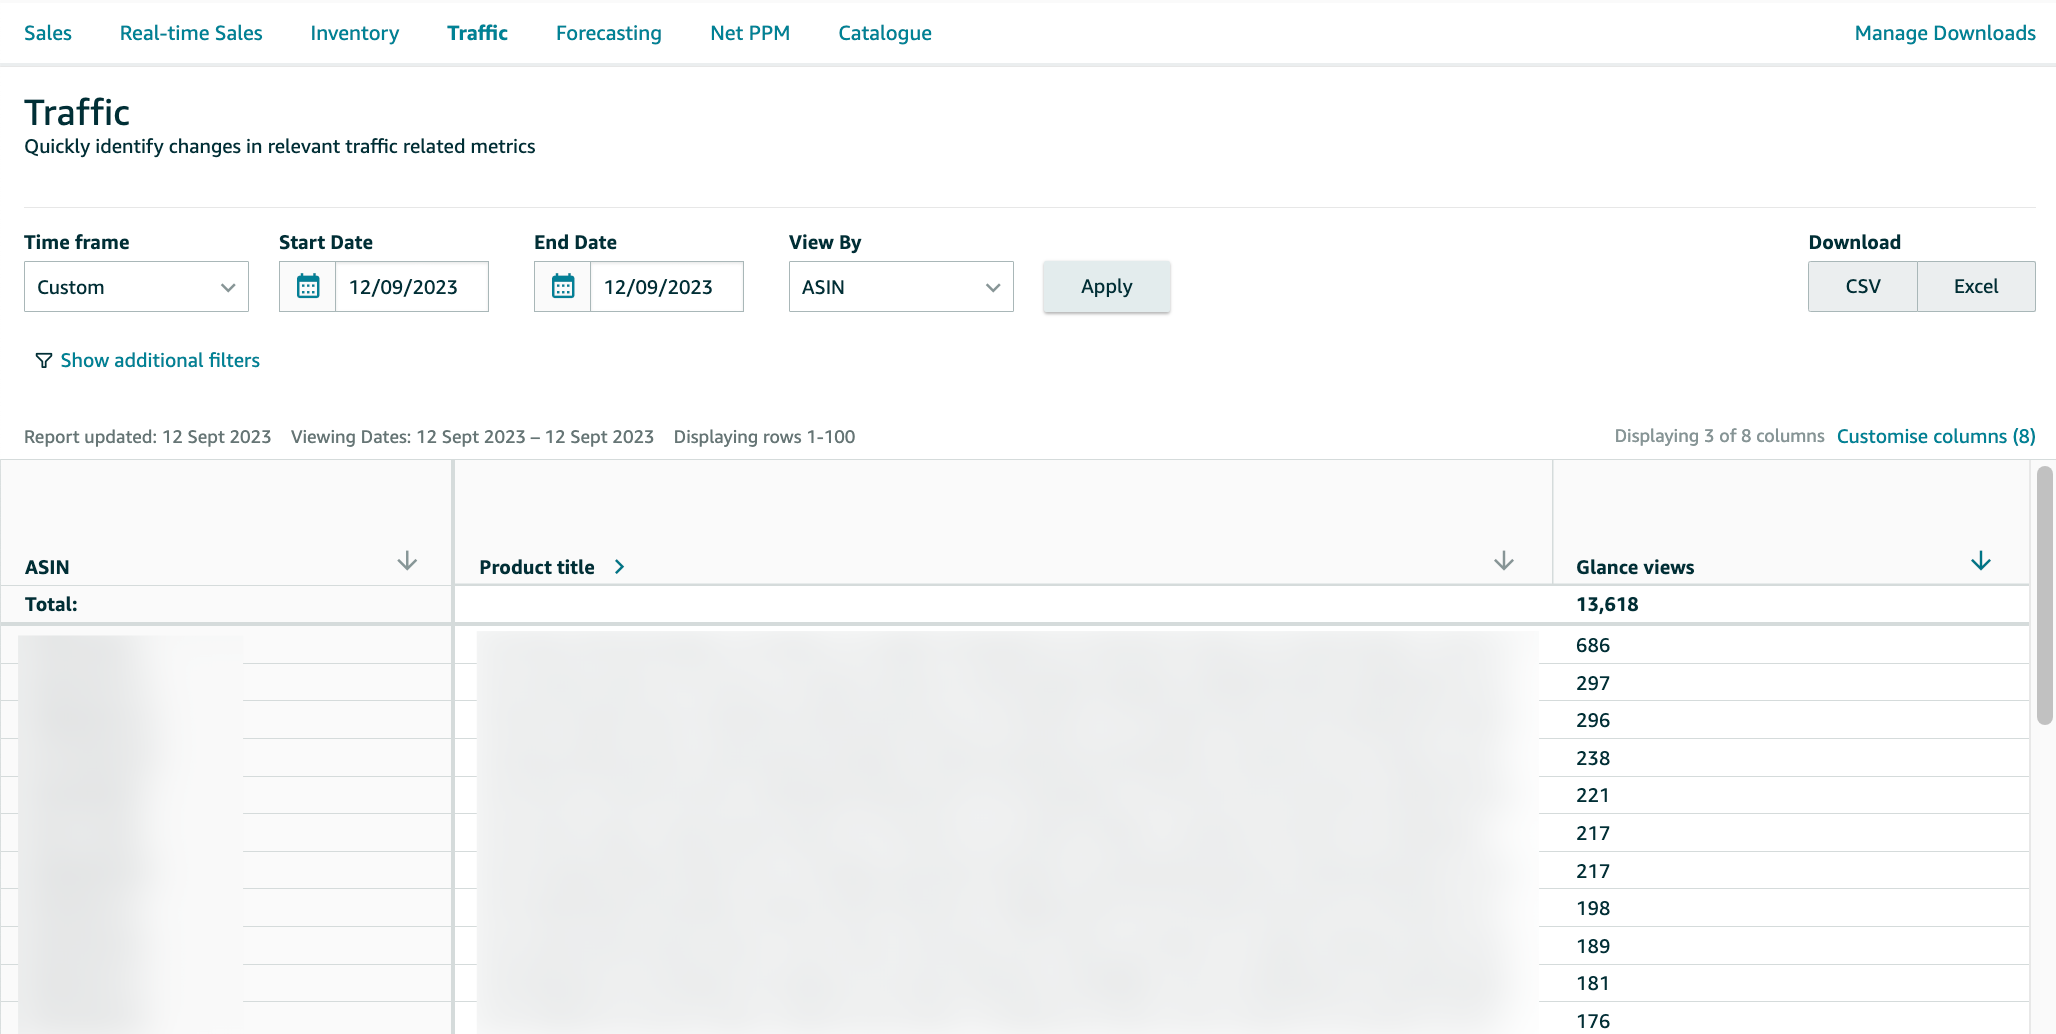
Traffic
The Traffic Dashboard provides you with an overview of the popularity of your products. For each ASIN, you can see the number of page views. Adjust the time frame to monitor ASIN developments.
Forecasting
The Forecasting Report is employed in supply chain planning to minimize the risk of understocking or overstocking. Here, Amazon provides an estimate of future weekly customer demand for each ASIN.
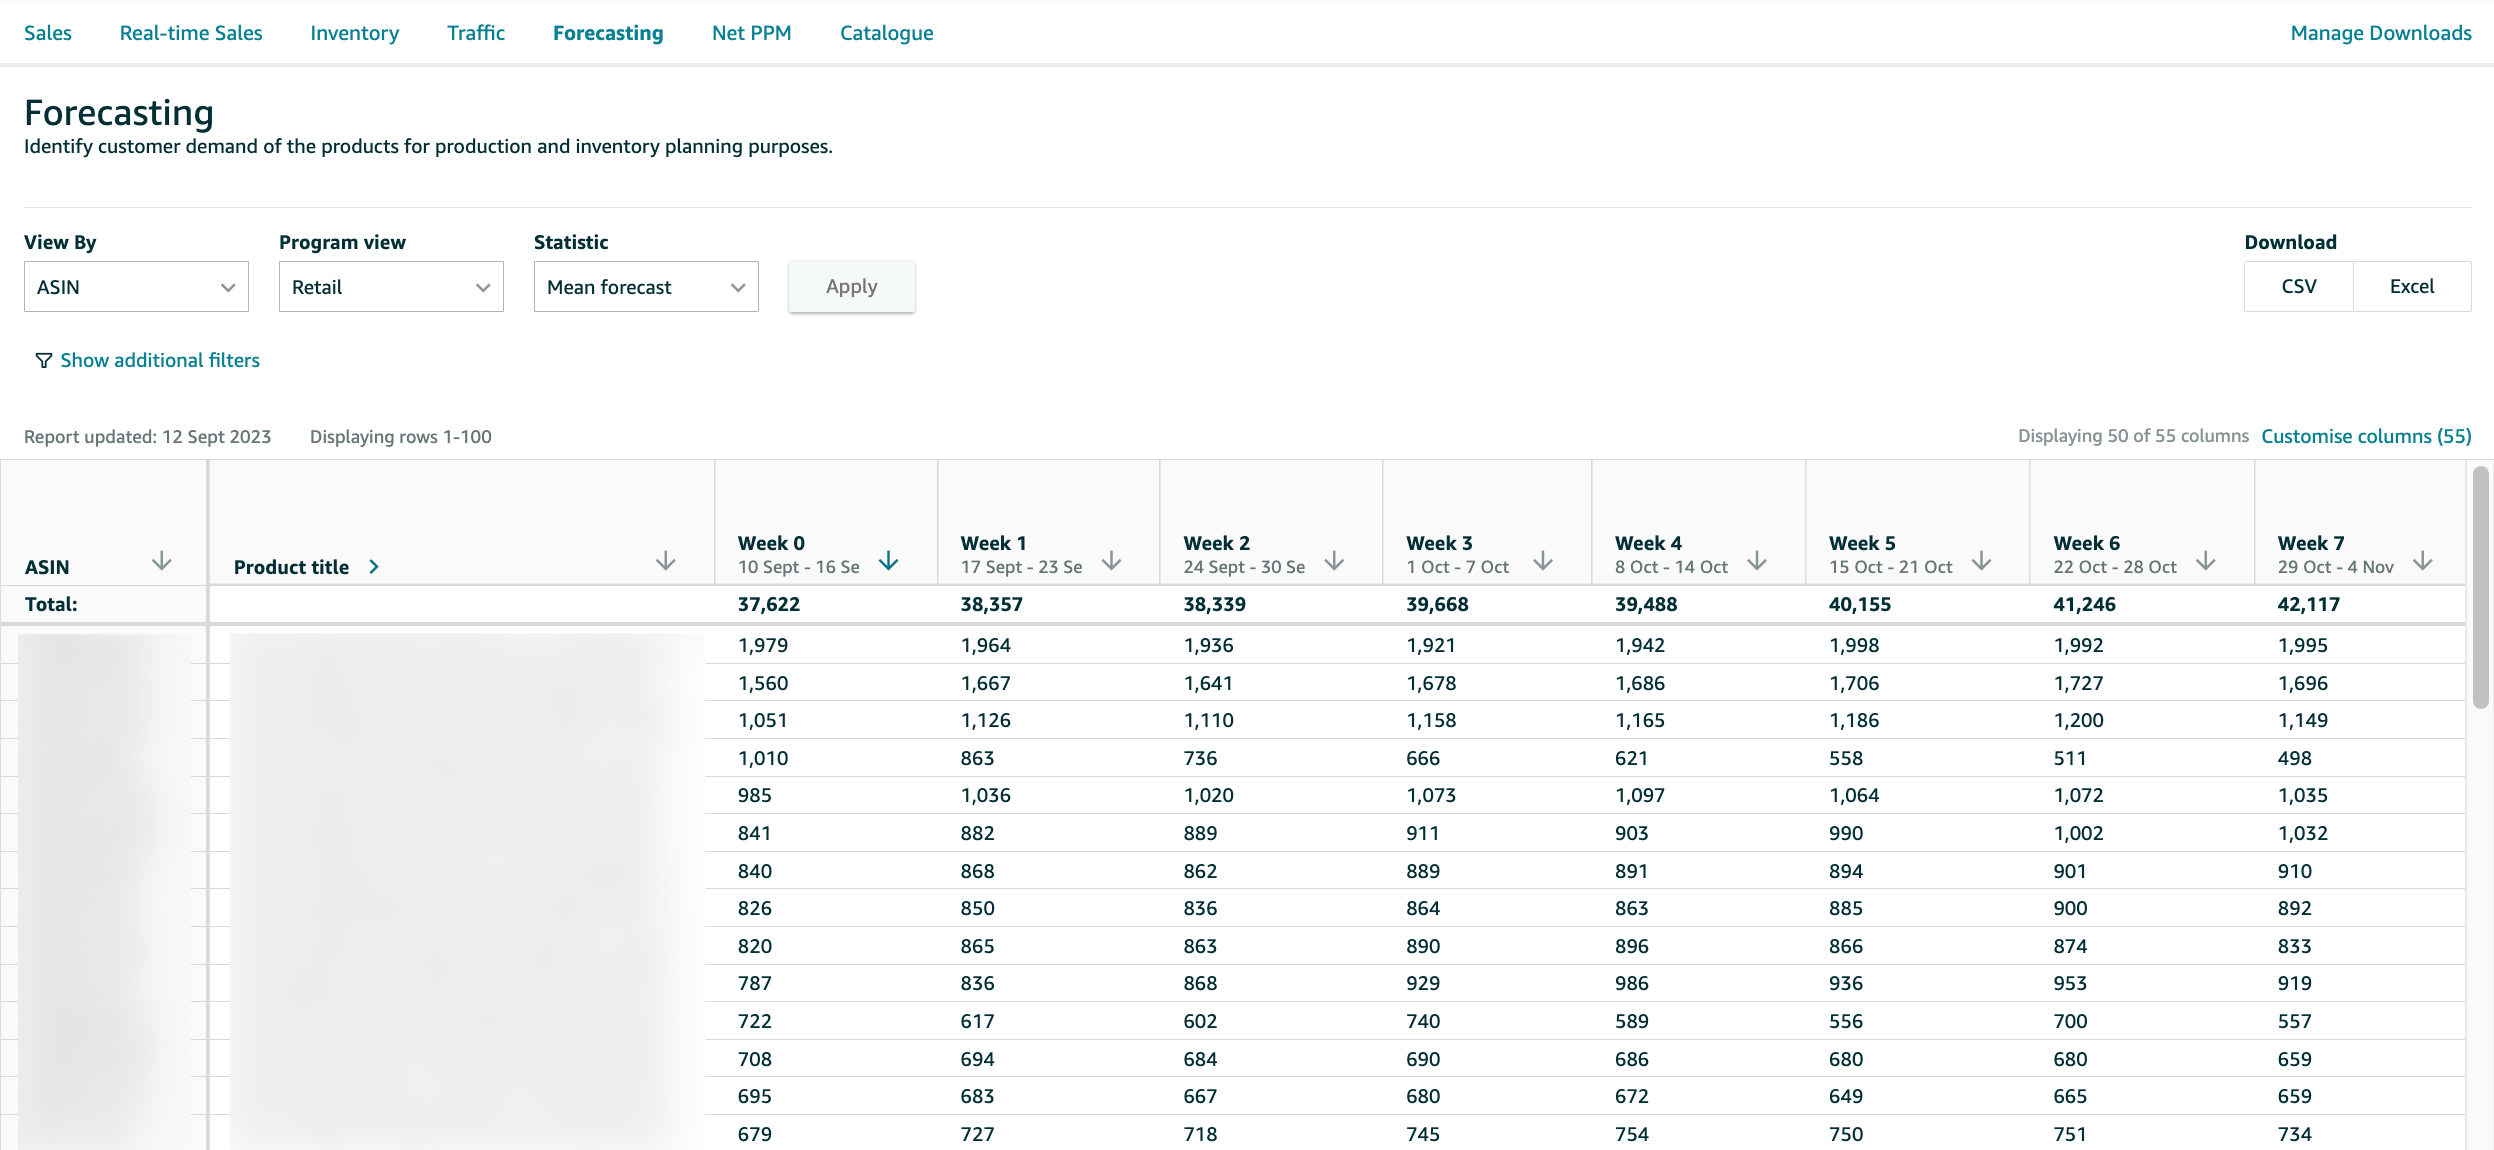
Within the statistics section, you can filter by P-levels. Amazon generates forecasts for an ASIN at various confidence levels. If you set a confidence level of 80, also known as “P80,” the ASIN is expected to be in stock for the corresponding week with an 80 percent probability.
Net PPM
The Netto Pure Product Margin (Net PPM) Report provides insights into which products contribute to the profitability of your brand.
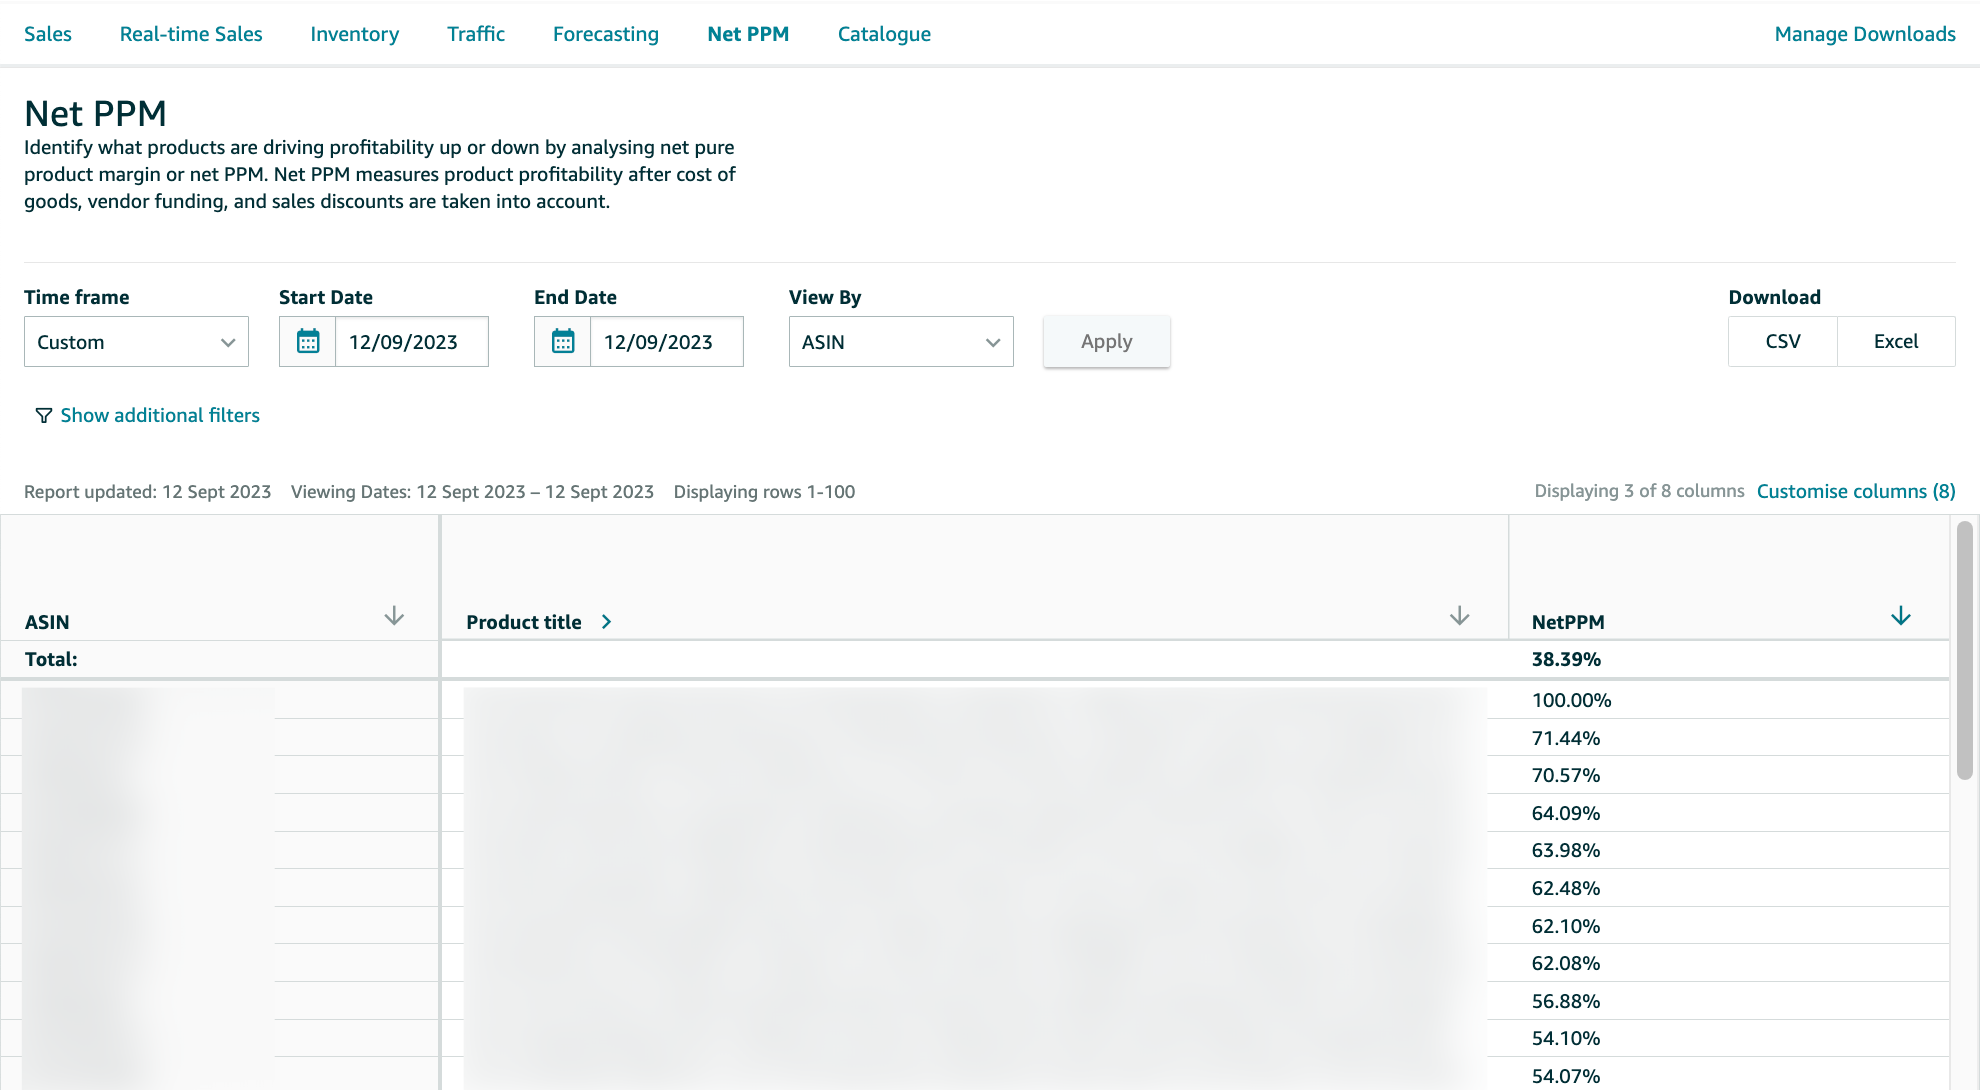
Amazon describes the metric Net PPM as follows: Net Pure Product Margin is the actual product profitability after deducting costs, taking into account product cost, supplier financing, and sales discounts. This metric allows you to determine whether a product generates sufficient profit relative to its revenue and whether operating expenses are within reasonable limits.
The table shows the Net PPM metric for the selected reporting period, the previous period, and the year-over-year comparison.
Catalogue
The Catalog Report provides a quick overview of the most important information about your catalog data.
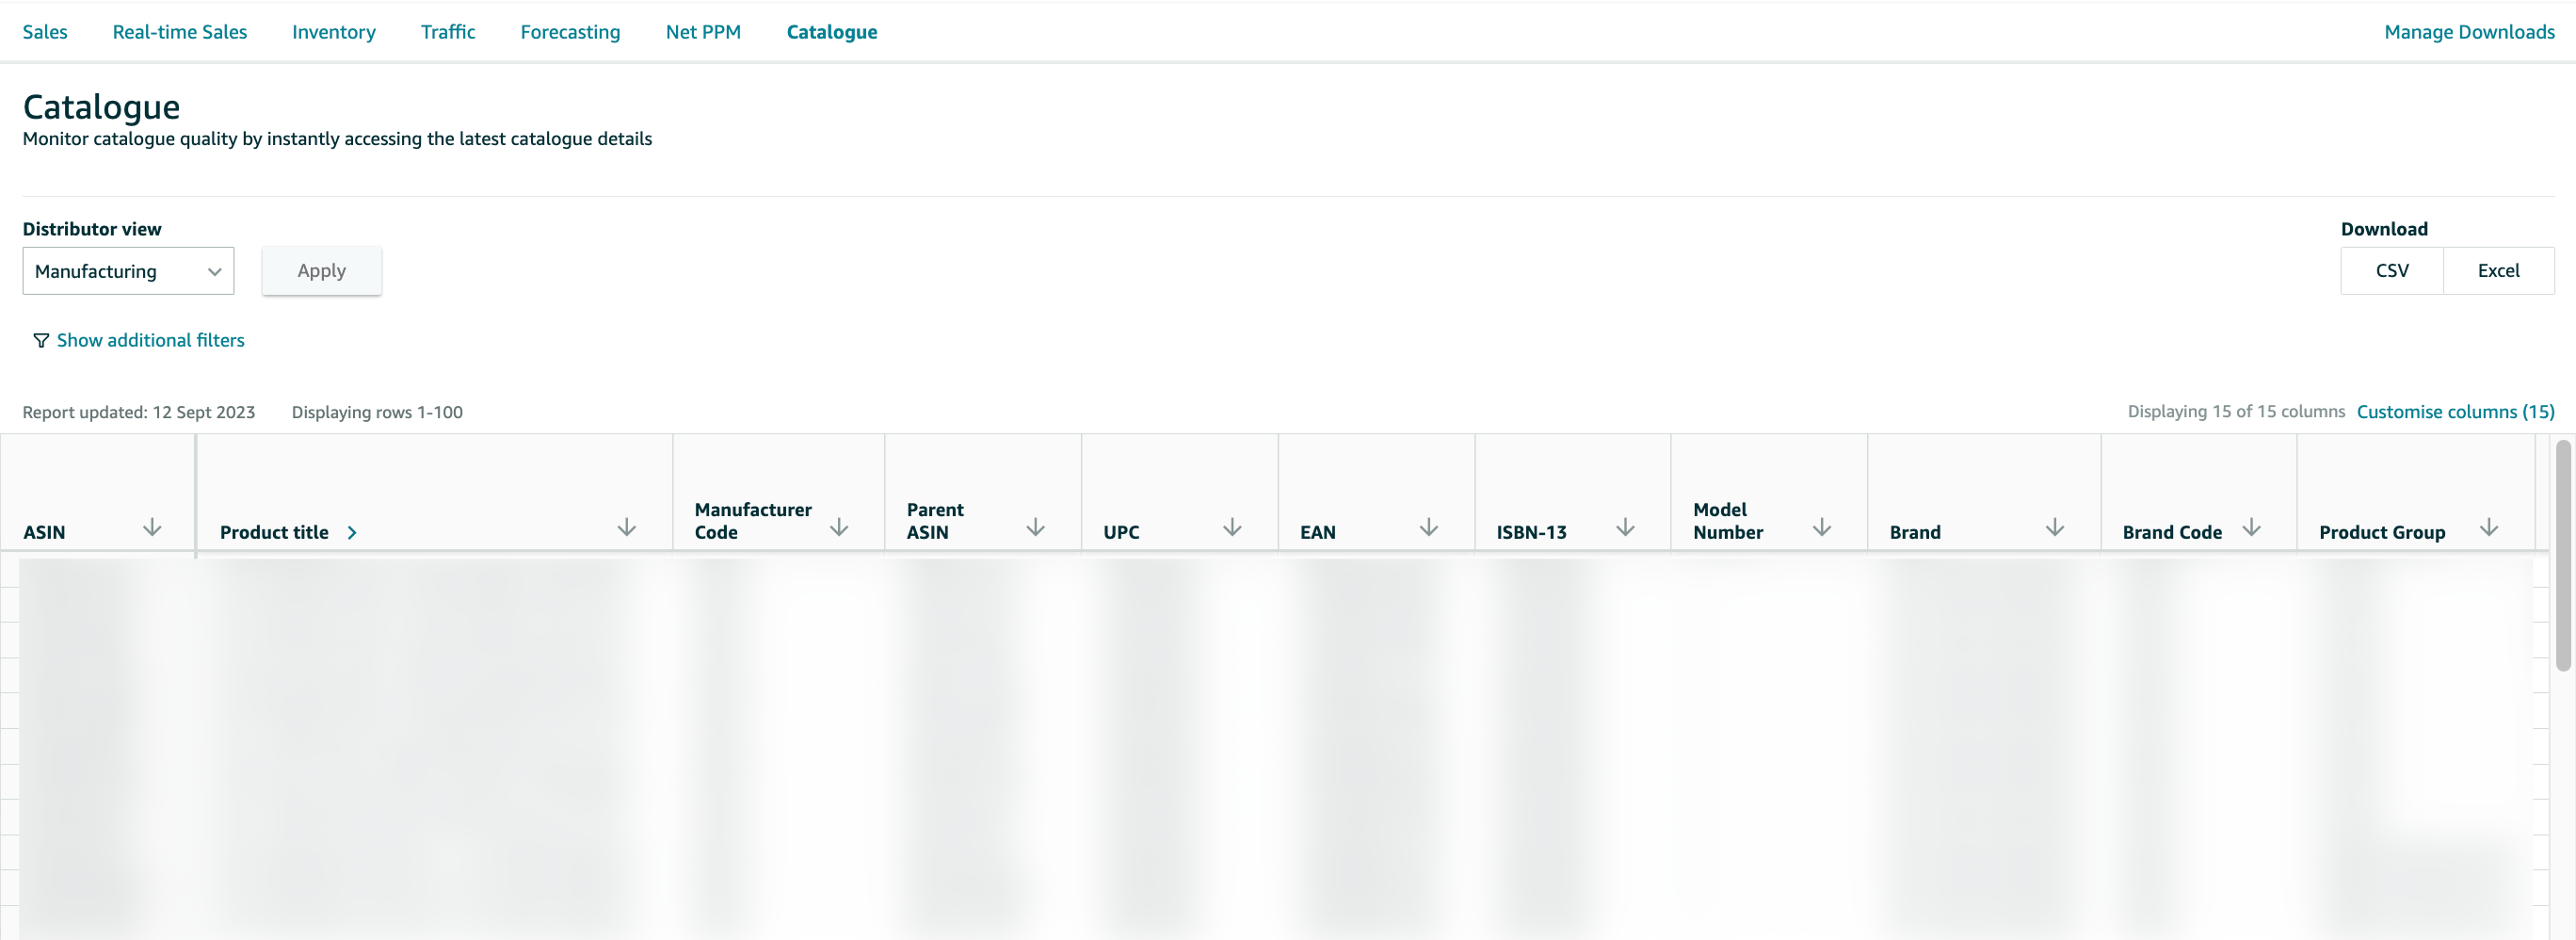
The report includes the following metrics:
- ASIN
- Product title
- Manufacturer Code
- Parent ASIN
- UPC
- EAN
- ISBN-13
- Model Number
- Brand
- Brand Code
- Product Group
- Release Date
- Replenishment Category
- Prep Instructions Required
- Prep Instructions Vendor State
Conclusion
Amazon Retail Analytics (ARA) is a powerful and, moreover, free analytical tool for vendors. It provides you with data on sales, inventory, and profitability for each ASIN you sell. Additionally, Amazon generates forecasts for future demand, and you receive a summary of key catalog data. Therefore, it is highly recommended that you make full use of this tool.
To further enhance your vendor performance, consider monitoring your Amazon Concessions Dashboard to reduce returns and improve customer satisfaction.
Subscribe to Newsletter
Get the latest Amazon tips and updates delivered to your inbox.
We respect your privacy. Unsubscribe anytime.