Amazon A/B Testing: Use Amazon Experiments to Maximize Conversion Rates
Trutz Fries
A/B testing allows Amazon Sellers and Vendors to test two different versions of a product title, main image, and A+ content simultaneously to see which variant leads to more sales. During the test (also called an “experiment”), customers are divided into two groups: one group sees the existing version, and the other group sees the new modified variant. After the experiment, Amazon shows which group resulted in more sales and the likelihood that the result is statistically valid.
Through A/B experiments, sellers and vendors can find out …
- which A+ content is suitable,
- which product images are more appealing to customers, and
- which product titles are more informative to customers.
In this article, you’ll get an overview of Amazon A/B testing, and we’ll explain how to set up and evaluate the tests.
What is Amazon A/B Testing?
A/B tests provide the opportunity to compare two versions of a product title, product image, or A+ content to determine which version leads to more sales. The two versions are called version A and version B.
Once the experiment starts, customers randomly see one of the two versions. One group of Amazon customers will permanently see version A of the content, and the other will permanently see version B. In addition, Amazon customers will see the same content in all possible places. For example, a tested product title is always displayed in search results, product detail page, and shopping cart.
The duration of the A/B tests is between 4 and 10 weeks. At the end of the experiment, it is determined statistically whether and if so, which version sells better. If the new version B leads to higher sales, you can adopt this version and hope for a better conversion rate in the future.
Who can run A/B tests on Amazon?
In principle, sellers and vendors can run A/B tests on Amazon. However, you must meet two requirements before the experiment:
- You must be a brand owner, and your brand must be registered in the Amazon Brand Registry.
- The ASIN from which you want to test the title, images, or A+ content must have generated enough traffic in the last few weeks. This is the only way to collect enough data to perform a meaningful analysis. Amazon does not specify how many views the ASIN must generate, but ASINs with too little traffic cannot be selected when creating an experiment.
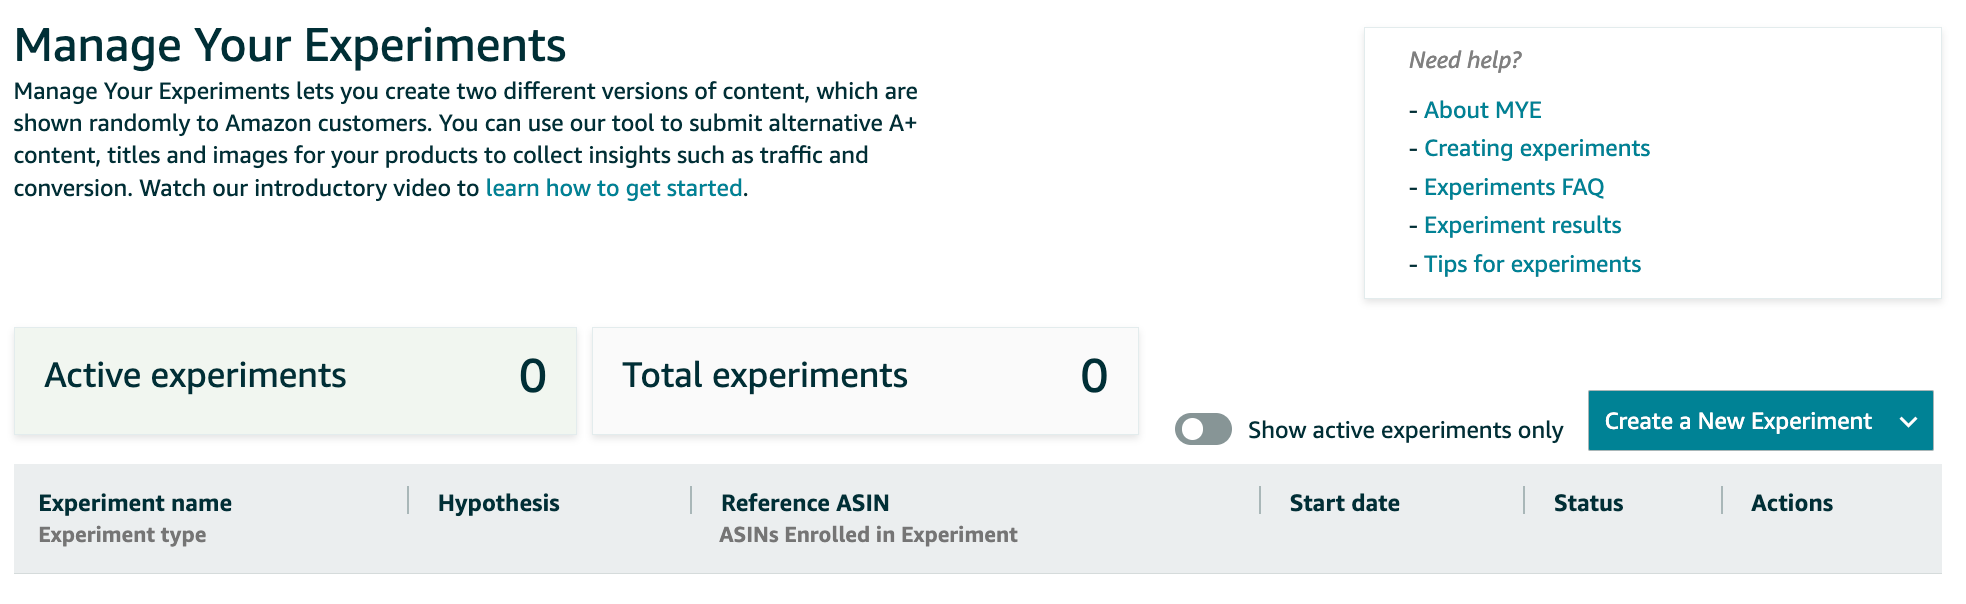
How do I run A/B tests in Vendor Central and Seller Central?
In Seller Central, under “Brands,” click “Manage Experiments.” In Vendor Central, click on “Manage your experiments” under “Merchandising.” In both cases, you will get the following overview:
The following is a step-by-step guide that explains how to perform an A/B test on Amazon. The steps are the same for sellers and vendors.
- First, determine whether you want to run an A/B experiment for the product title, main image, or A+ content:
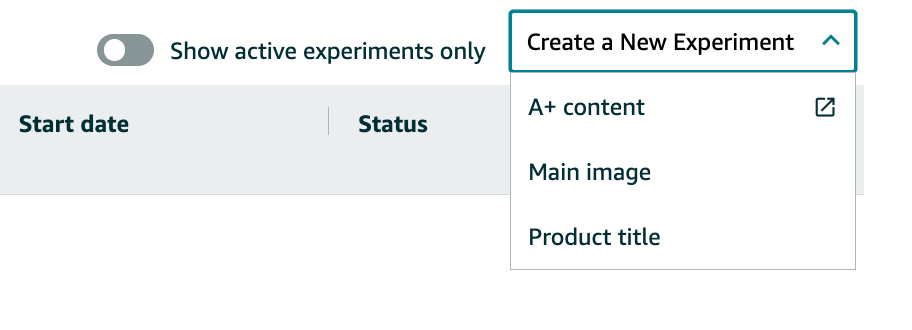
We will show you an example of how to run an A/B experiment for a product title.
- In the next step, you select the ASIN for which you want to run the experiment:
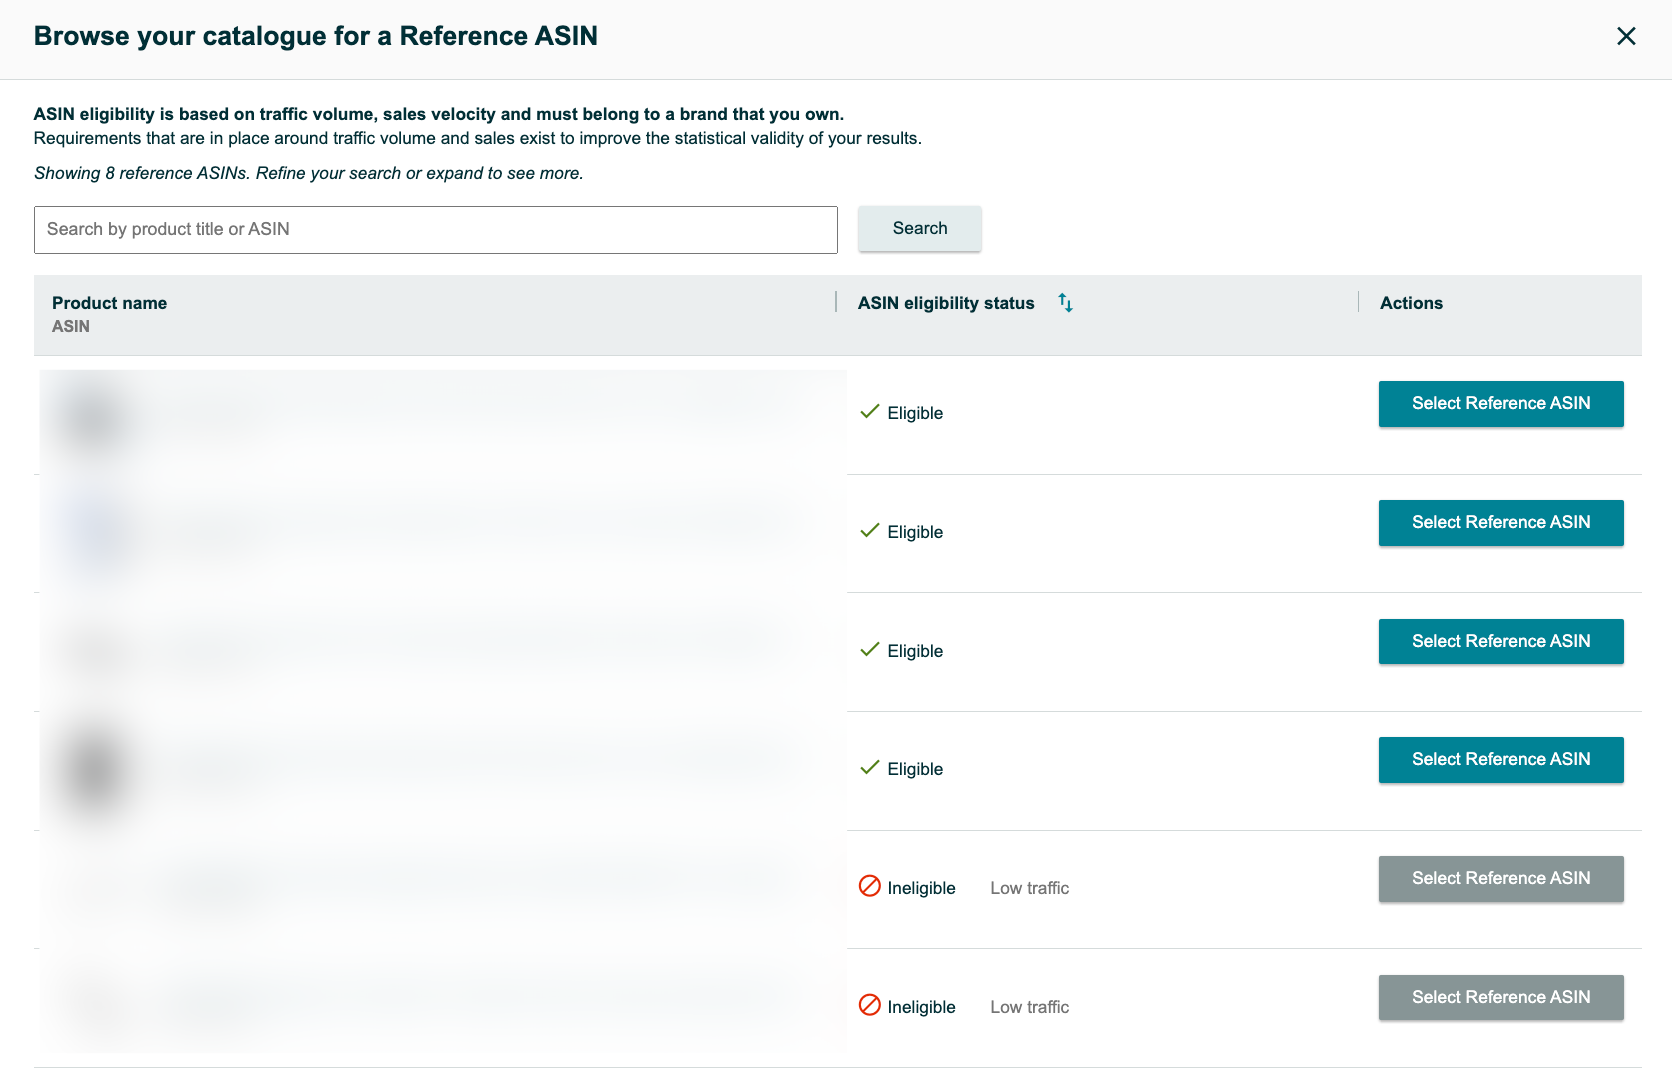
This list shows you all products you sell. In the column “ASIN eligibility status,” you can see if you can run the experiment with this ASIN. The column says “Ineligible, low traffic” for ASINs that have not generated enough traffic. You cannot select these ASINs.
- Then, provide the essential information about your experiment:
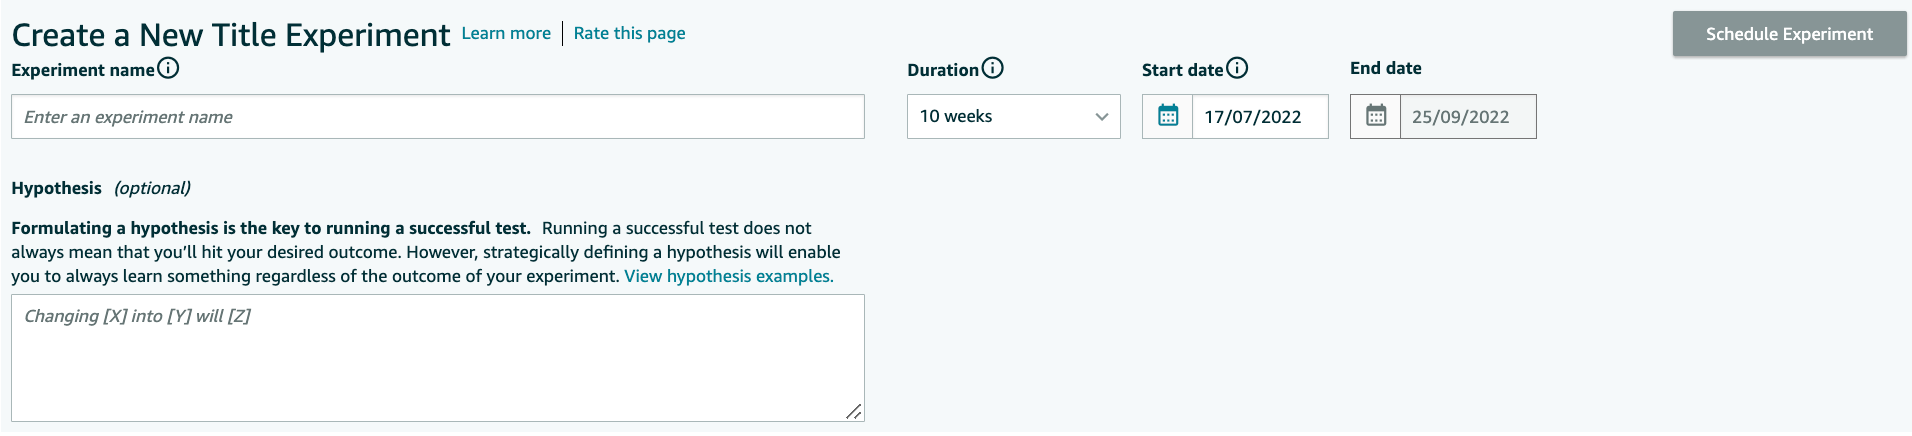
- Experiment name: only you will see the name, and it is essential so that you can identify the experiment.
- Hypothesis: the experiment should be the answer to the hypothesis you formulated. For example, a hypothesis could be, “If the color of the article is more in front so that it is visible in the title even on mobile devices, it will lead to more sales.”
- Duration, start and end date of the experiment: the duration recommended by Amazon is 8-10 weeks.
- Under the experiment information, you will see the ASIN you selected for the experiment and the current product title (version A):
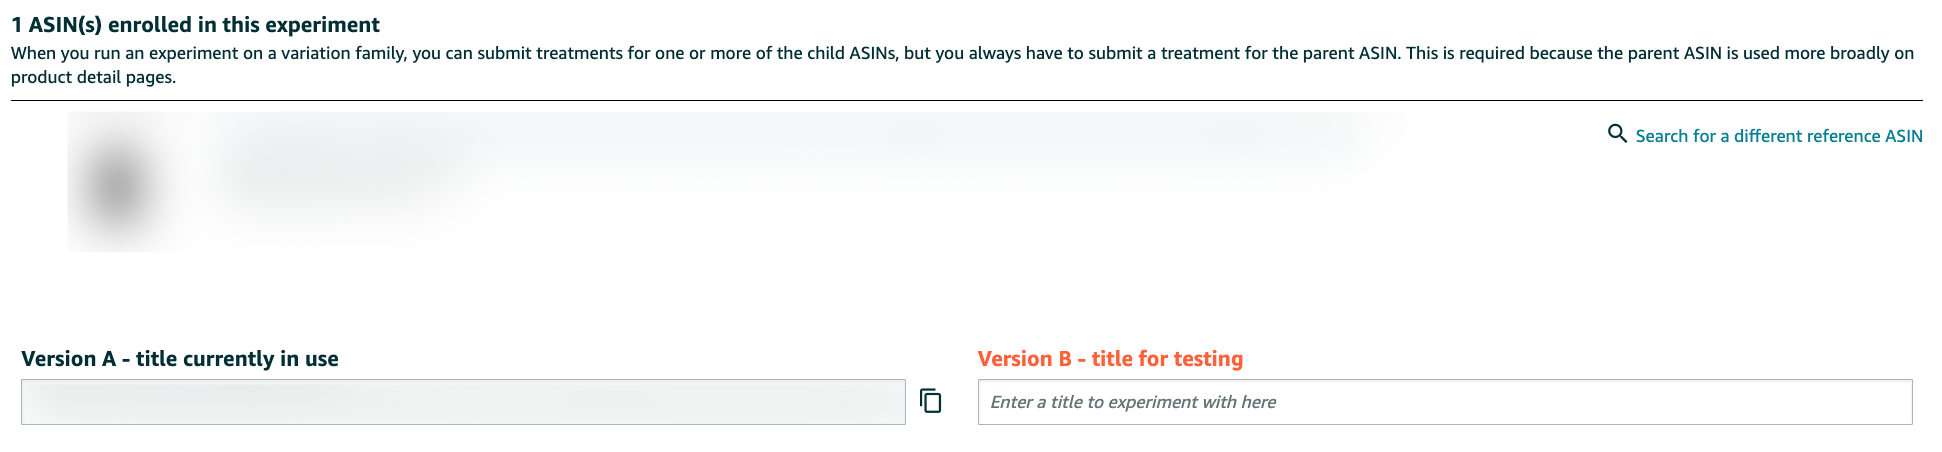
In version B, you specify the alternative title you want to test.
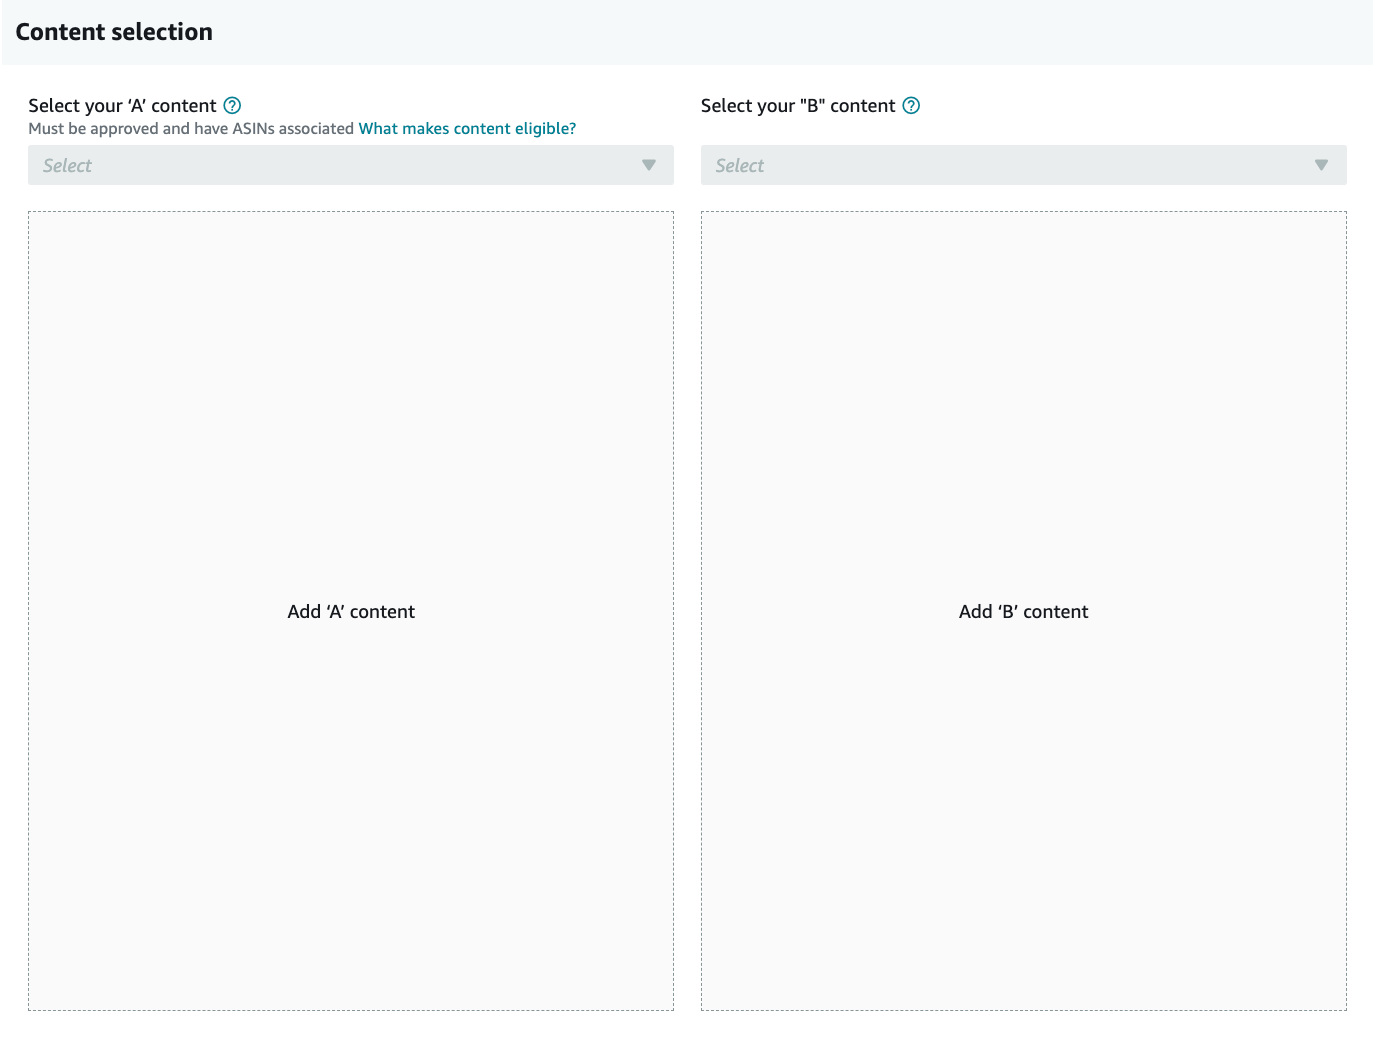
For product images or A+ content, this step is the same in terms of structure. The difference is that you upload another image or A+ Content instead of a title. For example, this is what it looks like for A+ Content:
If the ASIN is a variation family, you must also upload an alternate title for each child ASIN. Otherwise, you will not be able to start the experiment. However, the results of all variants will be added together at the end.
- In the last step, click on “Schedule Experiment.” Within 1-2 weeks, you will already receive the first results. But wait 8-10 weeks before interpreting the results and drawing conclusions.
Results of the A/B Testing
After the experiment, Amazon provides some metrics to evaluate the two versions.
For example, the results of the experiment may look like the following:
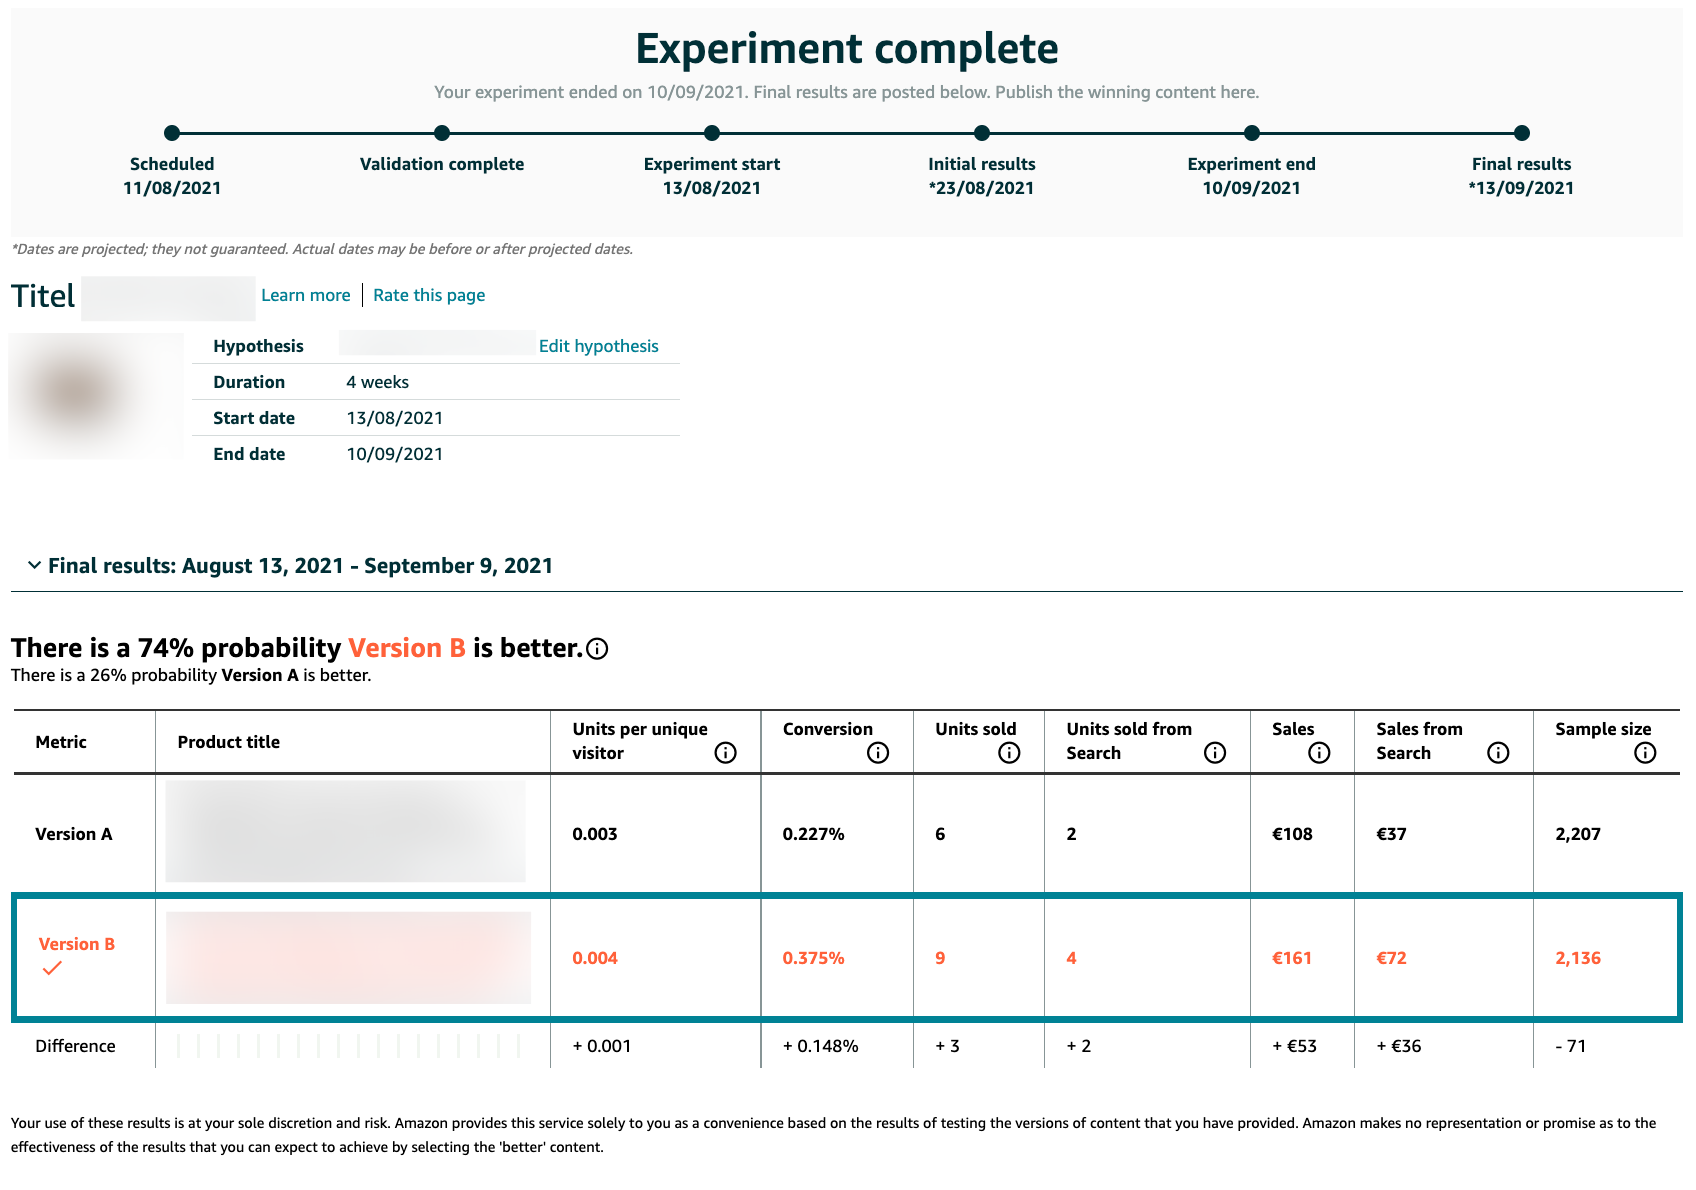
Below the timeline, you will see the essential information about your experiment given in step three: the name of the experiment, the hypothesis, and the start and end dates.
The probability that one version is more effective than the other.
In the evaluation, Amazon shows the probability that one version is better than the other. In this example, version B is better than version A with a probability of 74 percent. Version A is better than version B, with a probability of 26 percent.
Detailed key figures of the versions in comparison
In the table, Amazon shows you more key figures:
- Units per unique visitor: Amazon calculates the value with the formula: Total units ordered / Total number of visitors. Amazon emphasizes that only visitors who have seen the title, image, or A+ content are included in the experiment. Thus, not all visitors to the product detail page are counted.
- Conversion: Amazon calculates the value with the formula: Number of buyers (customers who bought at least one item) / Total number of visitors.
- Units sold: Sum of units ordered by customers.
- Units sold from Search: Sum of units ordered by customers who saw the product on the search page for the first time.
- Sales: revenue generated from the units sold.
- Sales from Search: revenue generated from the units sold when customers first saw the product on the search page.
- Sample size: Number of unique visitors who saw the product title.
However, a closer look raises questions. In our example, the “units per unique visitor” are almost unchanged for both versions. 2,207 Amazon visitors have seen the title of version A. Thereby, 6 units were sold. This results in the key figure “units per unique visitor”: 6 / 2,207 = 0.003. In version B, 0.001 more units were sold. That doesn’t sound like much at first, but it makes a difference of 33.33 percent.
Furthermore, the conversion rate is unfortunately not comprehensible. Amazon states that you calculate the conversion rate with the formula “number of buyers / total number of visitors.” However, Amazon does not disclose these key figures in the table.
Chart on units sold, total sales, and conversion rate
Below the table of key figures, you will find a bar chart for Sold Units, Total Sales, and Conversion Rate:
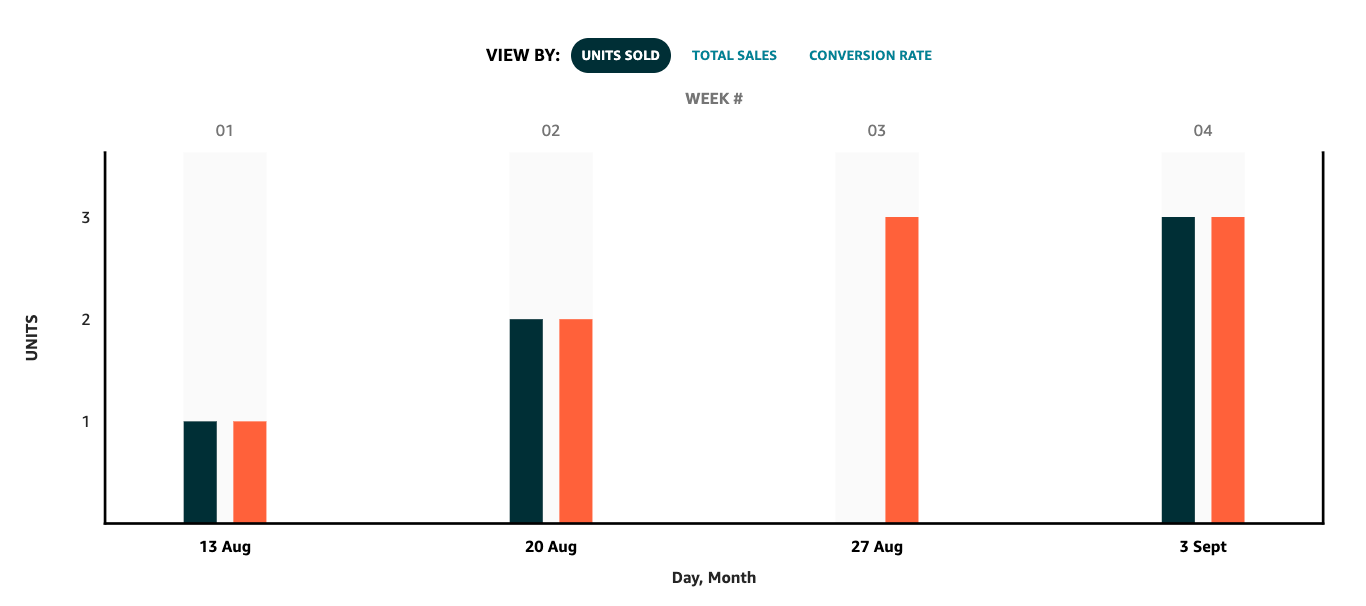
If you display the units sold, the chart shows how many products with the product title in versions A and B were sold during the experiment. In our example, you can see that in the first week of the experiment, one person whom Amazon showed product title A bought the product.
Here we also see that the same number of version A and B units were sold in all weeks except week three. Only in week three was no unit of version A sold. You should take this into account in the overall interpretation of the results.
Expected impact over one year
In another area, Amazon shows you an estimate of the potential positive sales impact over the next year that you can achieve by publishing the content version with better results.
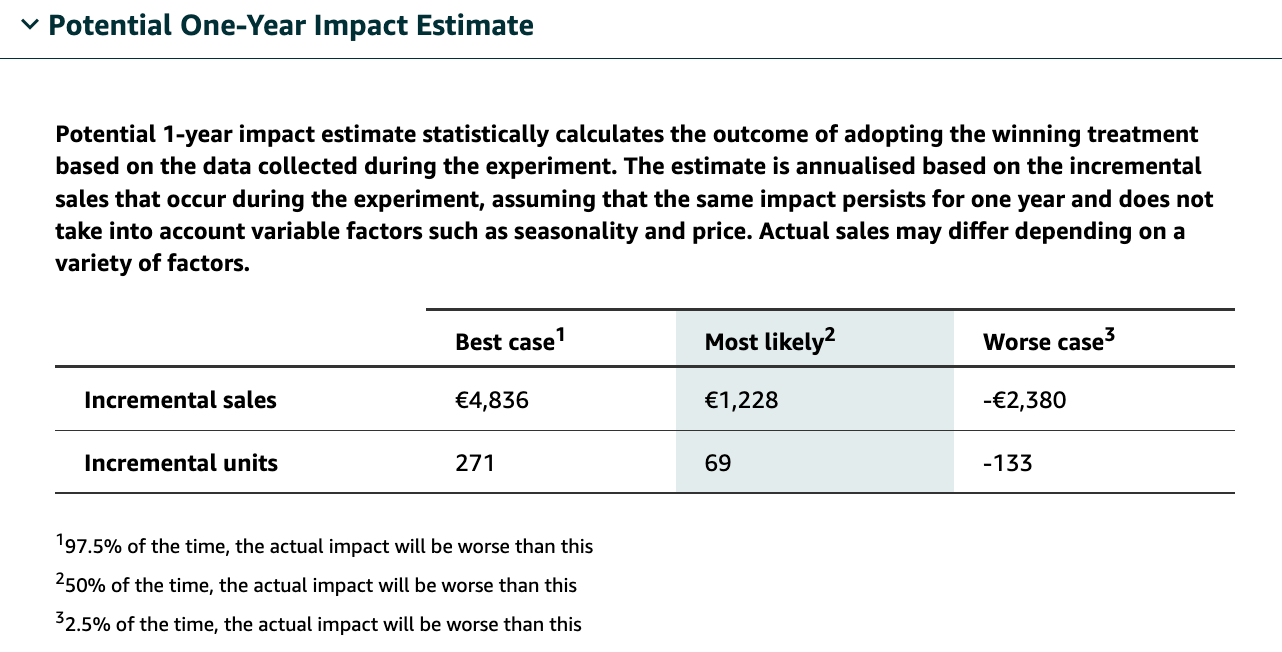
Most of the expected effects are positive if you can determine a better version with a high probability. If a better version can only be resolved with a low chance, the effects can also be negative, as in our example. Amazon justifies this by saying that the version that performed worse in the test could still serve better over time.
Amazon calculates the values with the formula: average sales increase per day (achieved by the better content) * 365 days. This means for the most likely case that, Amazon assumes that you generate approx. 0.30 euros (1,228 / 365) more revenue per day with the better version.
Amazon A/B Testing Tips
To ensure that the test results are as meaningful as possible, we have summarized the most important tips for you:
- Plan enough time for the test: The test duration should be between 8-10 weeks so that the experiment results are informative. This compensates for differences in user behavior depending on the week and day of the week. Especially with expensive products, it takes longer for customers to decide to buy. Therefore, a long experiment period is crucial to measure the conversion rate. Also, refrain from reviewing the results before the test is complete. Preliminary results may not be representative.
- Consider promotions during a test: Promotions can distort the test results, especially the expected impact over a year. Thus, it is better to avoid such side effects.
- Wait for a version to have a greater than 90 percent probability of being better: You should not decide until there is at least a 90 percent probability that one version is better than the other. In our example, the probability that version B is better than version A is 74 percent. The differences may be due to chance.
- Conduct several tests: You can continuously improve the product image, title, and A+ content. Test one change at a time to optimize your product detail page step-by-step.
Conclusion
A/B experiments can help vendors and sellers determine whether listing changes result in higher conversion rates. You can run tests to gather insights into how customers respond to a version of the A+ content, title, or main image.
However, you should evaluate A/B tests with caution. The results are only statistically relevant if you can generate a high number of sales across both versions in the tests. If the number of cases is small, the probability is comparatively high that the result was only generated by chance.
Before you change to the content, you should run an A/B test to check whether the change leads to the desired results. You can read how to optimize the elements of your content in our articles Amazon A+ Content, Amazon Product Title Optimization and Amazon Images Optimization.
Subscribe to Newsletter
Get the latest Amazon tips and updates delivered to your inbox.
By subscribing you agree to our Privacy Policy .