Assessment of the Demand and Competitive Environment for Amazon Products
Trutz Fries
Which products are bought more frequently? For Amazon Sellers, this question is of particular interest, because products with high demand rank before niche products. Furthermore high demand puts corresponding pressure on prices, as there are many suppliers of these products. Competitiveness depends primarily on the size of the supplier. Small sellers therefore tend to prefer a niche. If you are uncertain, suitable Amazon Tools will help you to get an overview of your market situation.
Determine demand by BSR
In order to be able to estimate the demand for a product and thus indirectly for a product type, the Amazon-Bestseller Rank (BSR). can be very helpful. Amazon determines this ranking hourly on the basis of the sales of the last 24 hours. It also compares how often a product has sold compared to other products in the same category. The BSR therefore has a tolerable relative significance. This is also illustrated in the attached illustration:
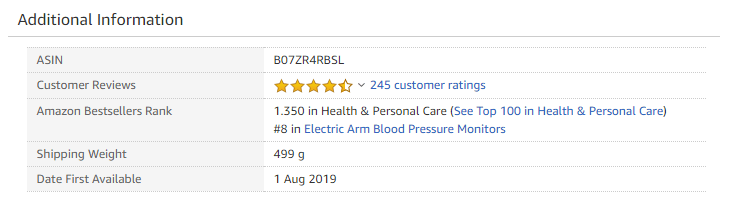
Evaluate the bestseller rank correctly
The product shown in the picture is a blood pressure monitor. It had a bestseller rank of 1.350 in the category “health & personal care” at the time of the screenshot. Of all products in this main category, this product ranks 1350st, based on sales figures for the last 24 hours. That means..:
The lower the BSR, the more often the product is sold
As the BSR is always to be considered relatively, it is therefore possible that the BSR may increase even though the number of sales has not changed. This happens when other products are sold even more frequently and therefore pass the product. The BSR can fluctuate greatly, for example with seasonal products. However, sellers can influence their sales in a targeted manner. Popular measures are for example voucher campaigns or price changes.
You can get a pretty accurate idea as an Amazon seller if you measure the BSR at several points in time. The search terms are also an important factor here, as they show at which position and with which search terms the product in question is displayed. This is how it works:
A product that is displayed further up in a large number of search queries has a higher BSR than products for which there is only a small search volume.
The estimates of certain BSR analysis tools available on the market, on the other hand, should be treated with caution, as it is unclear how these estimates are actually made. It is therefore most useful for you if several products are examined according to a generic search term. The following table illustrates this further:
| # | ASIN | Price | BSR | Sales (estimated) | Turnover (estimated) |
|---|---|---|---|---|---|
| 1 | B00440D8A6 | 23 € | 29 | 3.775 | 86.787 € |
| 2 | B00CJFDP9C | 28 € | 126 | 2.995 | 84.968 € |
| 3 | B001QB2MGM | 15 € | 294 | 2.006 | 30.070 € |
| 4 | B00A6QWL1E | 20 € | 1.198 | 476 | 9.515 € |
| 5 | B008KWO3Q2 | 20 € | 412 | 1.514 | 30.204 € |
| 6 | B01JRWU2ZO | 18 € | 22.626 | 28 | 504 € |
| 7 | B003YUBXFO | 38 € | 271 | 2.119 | 80.501 € |
| 8 | B00VV8FCXU | 16 € | 1.218 | 471 | 7.512 € |
| 9 | B001AIS28I | 60 € | 337 | 181 | 10.842 € |
| 10 | B008RM35S2 | 19 € | 1.999 | 300 | 5.697 € |
Table: BSR of the Top 10 products for the search term “blood pressure monitor” according to the tool “JungleScout”
The table example shows the search on Amazon for the term blood pressure monitor. In the search result, the first 10 products had a BSR between 29 and 22,626. Consequently, the average value here was 337. The estimated turnover data and sales figures are taken from the tool JungleScout (paid tool). According to JungleScout, the product in position 1 is sold almost 3800 times per month. At the current price this would correspond to a turnover of just under 87,000 euros. BSR figures cannot be compared between different categories. Comparisons between categories in terms of BSR figures are not possible. Products with BSR 100 in the category “Kitchen & Household” have different sales figures than products with the same BSR in another category. So it’s simply a matter of you, as an Amazon Seller, getting a sense of which products are in demand and sold more often.
Another important point for planning is if you know at what times certain products are more frequently requested and sold. Fluctuations in demand are often seasonal. Again, useful tools are used to help you determine whether a product is subject to seasonal fluctuations. One of these tools is called _Google Trends. (free online tool from Google, which shows the frequency of certain search queries over a certain period of time). _The following figure shows the process of searching for “Blood pressure monitor”:
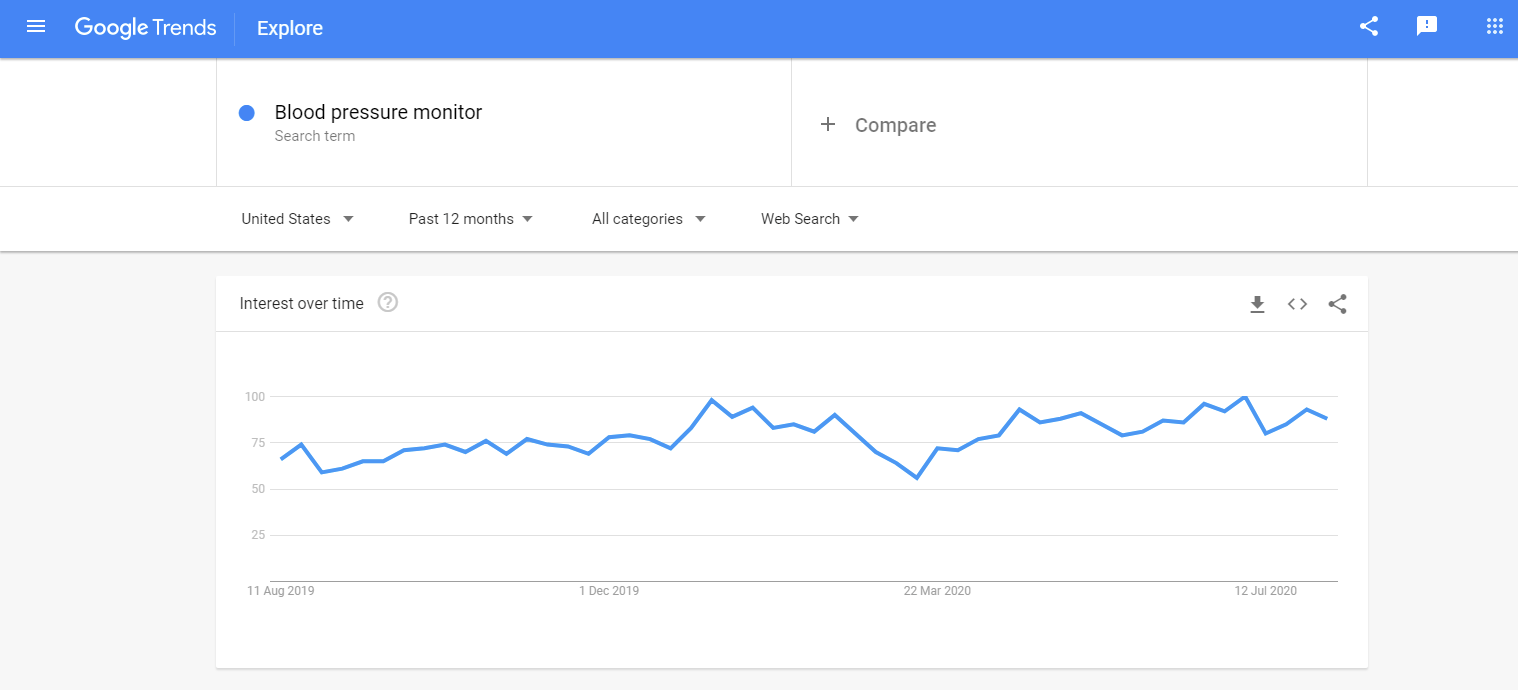
The scale represents the relative frequency of the search term “blood pressure monitor” in the last 5 years. As expected, demand for this product hardly varies seasonally, but remains stable over the timeline. Quite different from the product “string lights”, for example.
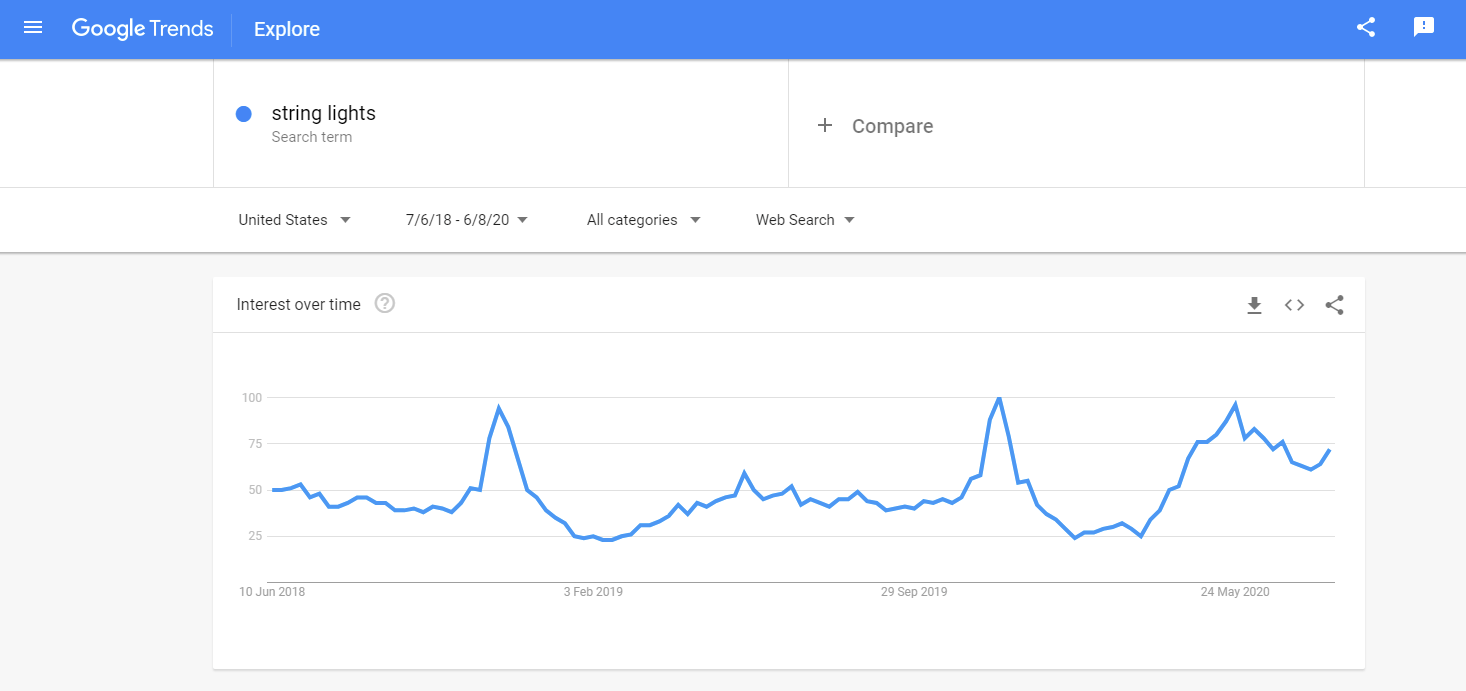
Two things can be observed with the search term “string lights”: Demand increases every year before Christmas. The long-term trend shows that the product was searched for more frequently each year.
Search volume on Google Trends and Amazon
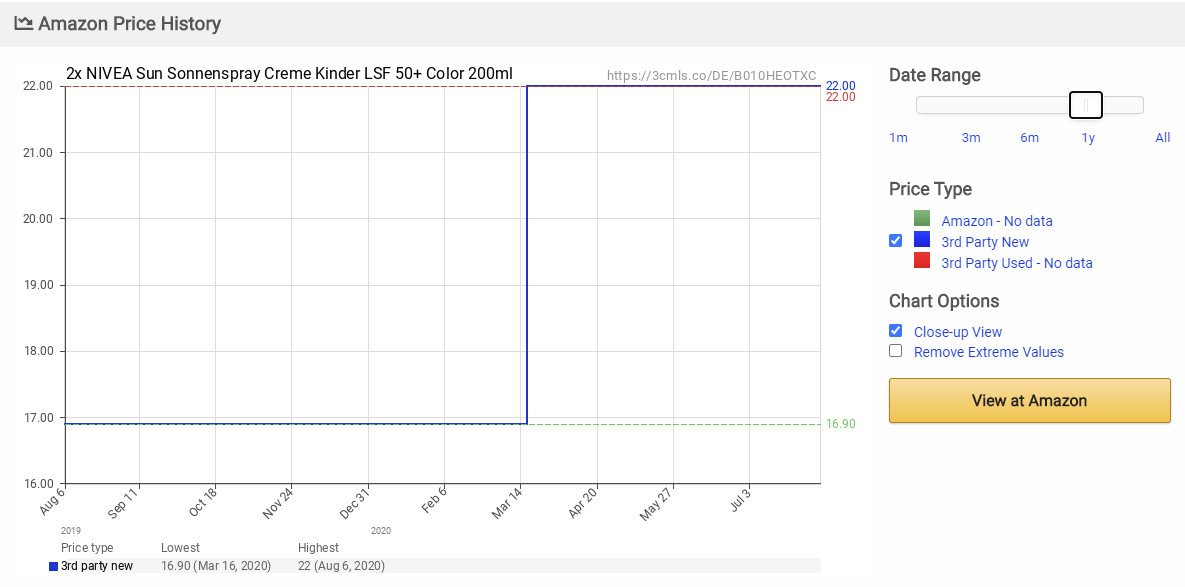
Although the Google Trends tool does not represent the search volume on Amazon, it can still be assumed that the result is representative. If you need it more specifically, we recommend using a tool such as [Keepa](http:// www.keepa.com), where you can enter an ASIN and, if available, you will receive the BSR history for the period in question. The following image illustrates this for the example of a specific sunscreen:
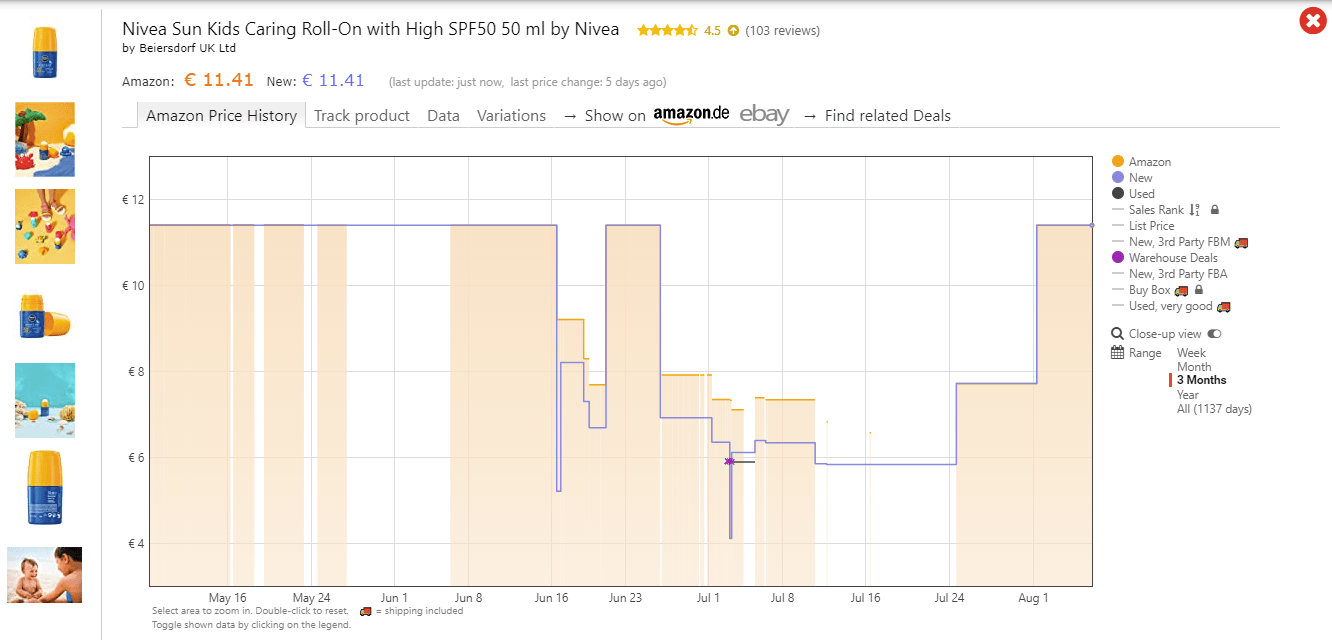
The seasonal demand can clearly be seen here. There are other tools with similar functionality, including camelcamelcamel.. A free account is required to use this tool. The result looks like this:
Assess the competitive environment correctly
An overview of the time periods and demand for products at Amazon has been provided. The key question now is: Will your product make it to the top? How can the competition be assessed correctly? The effort involved should be calculable and justifiable, so that the product can make it into the top 10 with certain search terms. These factors are used to assess how competitive the market for a product is:
- Number of products offered
- Number of sellers
- Price level and shipping method of the products
- Number and level of ratings of the top 10 products
- Number of sellers who place ads for the products
A simple Amazon search for the main search term of your own offer is helpful in this case. Not only are the search result lists returned, but you also also the number of products found for the search. The higher the number, the stronger the competition. The image shows this using the search term “iPhone case” as an example.
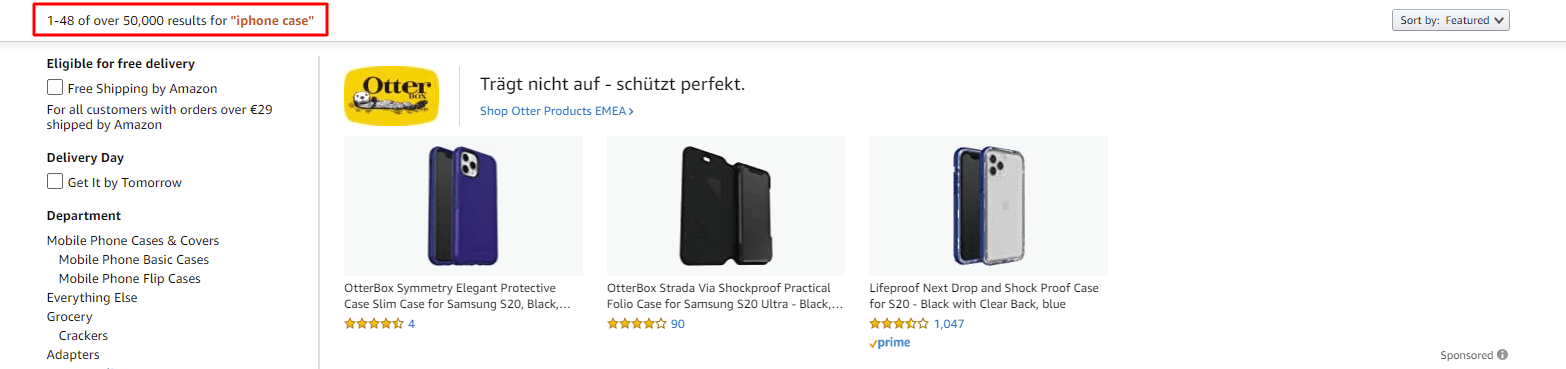
There are hardly any categories on Amazon that do not already have hundreds of offers. However, sometimes offers are displayed that do not fully match the actual search. For example the term “pillow” often includes “ink pads”.
Avoid a ruinous price war
It is important that you always pay attention to how many sellers are selling a particular product. Even a few sellers could cause a ruinous price war. If prices are obviously crooked, re-pricers are at work. Amazon itself also likes to get involved as a Seller and has an enormous competitive advantage due to its high position of trust. Amazon can also easily keep up with price wars.
Criterion: Current price level
There are often downward spirals in price formation. Buyers also often choose the overall cheapest offer (including shipping). You should calculate exactly whether you can still generate sufficient profit despite the current price level. Many buyers also take advantage of Amazon’s prime membership and use free shipping options if shipping is done through Amazon. In such cases, it is important to either use Prime for yourself or to consider whether you would rather offer another product that is not available thorugh Prime.
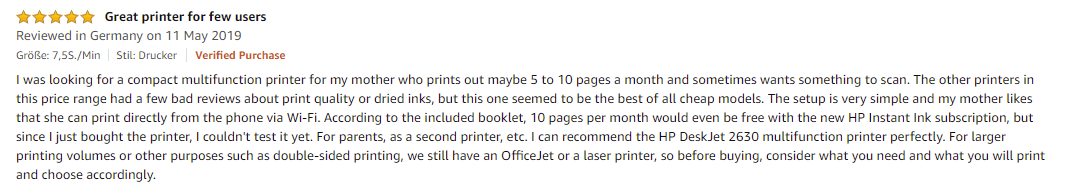
User reviews and their importance
Ratings are important. So take a closer look at the product reviews of the competition. Basically, the more positive ratings a product has, the higher its value will be. Amazon prohibits incentive-based reviews (which, for example, are created during product testing). It is therefore important to receive “real” reviews. Especially in the beginning this is difficult, because the number of sales depends on it. The more sales, the more ratings are possible and the better the product ranks in the search lists.
Sponsored Products / Ads
Please take a look at the ads (e.g. Sponsored Products) that other sellers place on common search terms for their product. If you cannot find any ads there yet, you can move your offer to the top of the search results for a relatively low price. This would be an immense advantage. The use of niche keywords could also be helpful.
More articles that may interest you:
Subscribe to Newsletter
Get the latest Amazon tips and updates delivered to your inbox.
We respect your privacy. Unsubscribe anytime.