Amazon Ads Report EU 2026: What 1.36 Billion Ads Reveal About Advertising in Europe


How many ads run on Amazon in Europe on a single day? Which marketplace is the most crowded, when do competitors launch their Black Friday campaigns, and which agency runs the ads of which brand? No EU country publishes numbers on any of this. Amazon knows. Everyone else guesses.
There is one exception. Under the EU Digital Services Act, Amazon has to document every ad shown in its EU stores in a public archive. Hardly anyone analyzes it. At the end of October 2026 we queried it systematically: ad counts for all nine EU marketplaces, the restricted ads, Amazon’s own ad accounts across Europe and a deep sample of one million individual ads from amazon.de, the largest store.
This article presents some of the findings of our Amazon Ads Report EU 2026. Every analysis, the agency ranking and the method are in the report.
25 pages with every chart, the agency ranking and the method: Download the Amazon Ads Report EU 2026 for free
The data source: Amazon’s public ad archive
Article 39 of the Digital Services Act requires very large online platforms to keep a public repository of their ads until one year after an ad was last shown. Amazon does this in its Ad Library for amazon.de, .fr, .it, .es, .nl, .pl, .se, .com.be and .ie. The UK and Turkey are not included. Each entry lists the advertiser and the payer, the advertised product, the run time, lifetime impressions (in ranges of 1,000) and, if applicable, a restriction.
There are no budgets, bids, clicks or sales. The archive doesn’t say whether an ad is Sponsored Products, Sponsored Brands, Display or Amazon DSP, and it lists no keywords. It shows who is visible and how much, not who makes money from it. The quirks you need to know to read the numbers are covered in the report’s data source chapter.
How big Amazon advertising is in the EU
The archive holds 1.36 billion ads from the last twelve months. On October 26, 2026, 91.5 million ads ran across the nine EU stores on that single day.
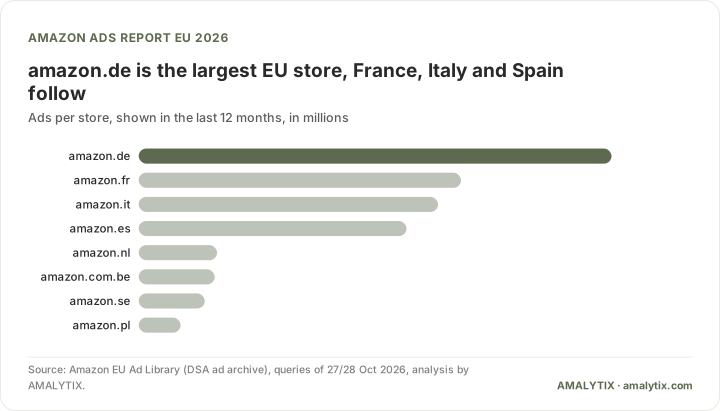
| Store | Ran on Oct 26 | Week Oct 19–25 | 12 months | Share of EU (day) |
|---|---|---|---|---|
| amazon.de | 31.8m | 58.4m | 376.2m | 34.7% |
| amazon.fr | 17.5m | 36.3m | 256.5m | 19.1% |
| amazon.it | 14.7m | 32.0m | 238.2m | 16.0% |
| amazon.es | 13.7m | 29.3m | 213.1m | 15.0% |
| amazon.nl | 4.0m | 9.9m | 62.3m | 4.4% |
| amazon.com.be | 3.2m | 9.0m | 60.5m | 3.5% |
| amazon.se | 2.8m | 7.7m | 52.6m | 3.1% |
| amazon.ie | 2.0m | n/a | n/a | 2.2% |
| amazon.pl | 1.9m | 4.9m | 33.4m | 2.1% |
amazon.de is the largest store by far, carrying 35% of all running ads. But France, Italy and Spain together run 45.8 million ads a day, more than Germany’s 31.8 million. If you advertise weekly on amazon.de, you compete with around 58 million other ads. In France it’s 36 million, in Poland 5 million.
Ad density differs sevenfold
Divide the running ads by population and the picture gets sharper.
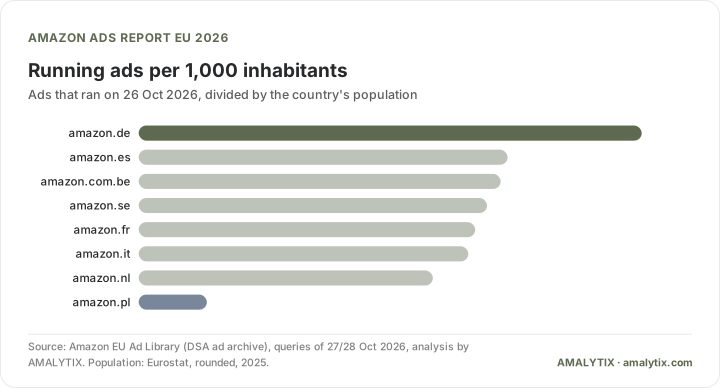
amazon.de leads with 380 ads per 1,000 inhabitants, about 50% more than France or Italy. Even counting Austria, which amazon.de also serves, it’s still around 340. Spain, Belgium, Sweden, France and Italy sit close together between 249 and 279, so the small Belgian and Swedish stores are already as crowded as the big ones. Poland is the outlier at 52. amazon.pl only launched in 2021, and competition for ad space there is still low. The report also shows in which store the most campaigns run always-on and where short bursts dominate.
786,000 new ads a day on amazon.de
For the time series we counted every day for a full year on amazon.de, Europe’s largest store. The number of active ads is remarkably steady: from November 2025 to June 2026 it stayed within 5% of roughly 92 million. The more telling number is how many ads start each day.
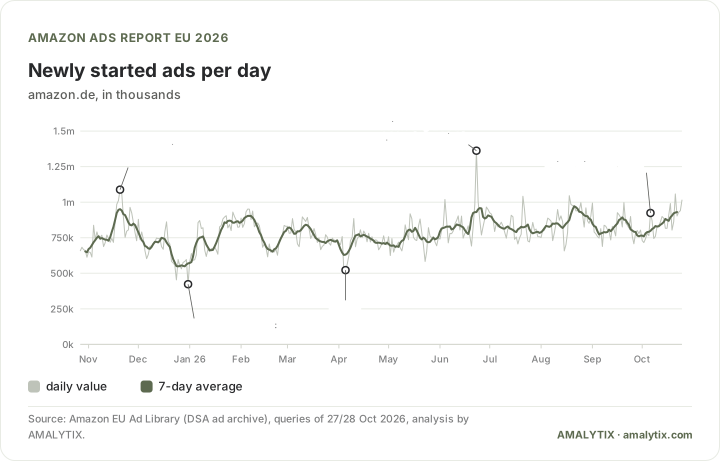
On average, 786,000 new ads start on amazon.de every day, about nine per second. In October 2026 it was 13% more per day than in January, so launches are still growing.
- Tuesday is launch day. It’s the strongest weekday, Saturday the weakest (−10%). Many record days of the year were Tuesdays.
- Holidays show up clearly. New Year’s Eve saw 46% fewer launches than usual, and Christmas Eve and Easter are visible dips too.
- Weekdays don’t matter for active ads. No weekday deviates more than 0.1% from the weekly average. Once advertisers are in, they stay in.
Black Friday starts a week early
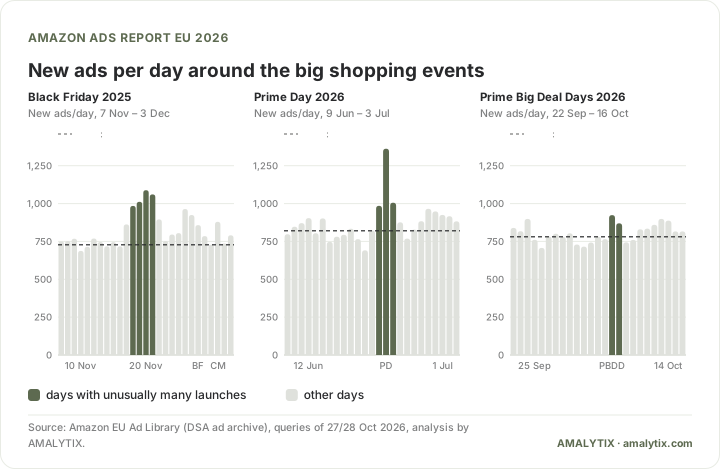
The big shopping events look very different in the launch data. Before Black Friday, advertisers prepare in advance. On Prime Day, they swap their ads on the day itself.
| Event | When do the new ads arrive? | Peak day | vs. base |
|---|---|---|---|
| Black Friday (Nov 28, 2025) | one week before, Nov 19–21 | 1.09m (Nov 20) | +50% |
| Prime Day (Jun 23–26, 2026) | on the first day, while 1.39m ads end | 1.36m (Jun 23) | +66% |
| Prime Big Deal Days (Oct 6–7, 2026) | on the first day, much weaker | 0.92m (Oct 6) | +18% |
The first Prime Day was the strongest launch day of the year. At the same time 1.39 million ads ended: advertisers swapped their campaigns on the day. Black Friday worked differently. Most new ads arrived a week before the event, and hardly any ended over the Black Friday weekend itself.
If last year’s pattern holds, Black Friday 2026 campaigns (November 27) should be live by November 18–20. That’s when most competitors launch too, and bids and visibility shift before the event itself. We measured this on amazon.de; whether France, Italy and Spain follow the same rhythm is part of our next analysis. How to get your campaigns ready is in our post on Black Friday 2026 on Amazon. For the full calendar, see our overview of Amazon events.
Who advertises on Amazon
For the deep analyses we took a random sample of 363,582 ads from amazon.de and derived each payer’s origin from its legal form and company name, such as “Co., Ltd”, “You Xian Gong Si” or the German GmbH, UG and KG.
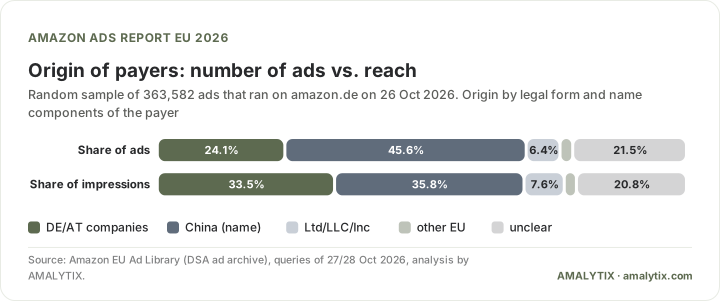
Almost every second ad (45.6%) is paid for by a company with a Chinese name. Those ads get only 35.8% of the impressions. German and Austrian companies pay for 24.1% of the ads and get 33.5% of the impressions, which is 1.8 times the reach per ad. Companies from other EU countries (S.r.l., B.V., S.L., Sp. z o.o.) pay for just 2–3% of the ads on amazon.de.
Since many “Ltd” companies and many unclear names probably belong to Chinese sellers too, the China share is more likely a lower bound. And the shop name rarely tells the full story: for 86% of all ads, payer and advertiser have different names. Behind that are agencies, parent companies and trading companies.
What else the report shows
Payer origin is only the start. The report takes the archive further, with numbers, charts and examples from large brands:
Volume or impact
Reach is extremely unevenly distributed, yet no single seller dominates. Two opposite strategies sit behind that: print-on-demand sellers advertise thousands of designs with little reach each, brands bet on a few very large ads. The report shows how wide the gap is and who the largest “advertiser” on amazon.de really is.
Brand Stores and evergreen ads
Almost every ad leads to a single product page. The few that link to a Brand Store, however, are among those with the most reach, and many successful ads have been running for years. How much more reach Brand Store ads get and how old the typical ad is, you’ll find in the report.
Brands, agencies and other people’s brand names
We checked the brands with the largest search share on amazon.de: who advertises in-house, who through an agency? Along the way it turns out that many ads with a brand name in the title don’t come from the brand at all. On some large names, accessory sellers and print-on-demand providers get more reach than the brand owner. That isn’t automatically unlawful: resellers and accessory providers may usually state what their product is for. But for the brand, visibility on its own name ends up with someone else.
The agency ranking
Because agencies appear in the archive as advertisers, you can measure which agency steers how much reach for which clients. The report includes the agency ranking with their best-known clients, the accounts they run across several countries, and what the ranking does and doesn’t tell you.
Amazon advertises on Amazon
Amazon promotes its private labels through its own “Amazon Omni” accounts in several EU countries. The report lists the largest Omni accounts in the EU, what they promote and how Amazon cut its own advertising in 2026 earlier and harder than the rest of the market.
Restricted ads
Restrictions are rare, and most are detected automatically. The report covers the reasons Amazon restricts ads and compares the stores. One of them restricts far more often than amazon.de.
Agency ranking, other people’s brand names, Amazon’s own ads and the method: Download the Amazon Ads Report EU 2026 now
What this means for your Amazon advertising in Europe
The archive has no budgets or sales. It still offers some clear pointers for optimizing your PPC campaigns across marketplaces:
-
Plan per marketplace
amazon.de is the largest store, but France, Italy and Spain together run more ads. Poland has a seventh of Germany's ad density, so competition for ad space is still low.
-
Start the season early
On amazon.de, most new Black Friday ads launched a week before the event. For November 27, 2026 that means being live by around November 19.
-
Watch your competitors
The archive is public in all nine EU stores: you can see when a competitor launches new ads, how long they run and which agency runs them.
More recommendations, on your own brand name, Brand Store ads and checking creatives per country, are in the report.
Conclusion: huge, stable and very fragmented
Amazon’s ad archive makes a market visible that no EU country has published figures on. Amazon advertising in the EU is huge and stable: more than 91 million ads run on a single day across nine stores. amazon.de is the largest and most crowded store, but France, Italy and Spain together carry half the market, and smaller stores like Poland are still wide open.
The limits remain. The archive shows who is visible and how much, not who makes money from it. Many values rest on samples and our own classifications, and the detailed analyses cover amazon.de; other stores may differ. Next, we’ll track Black Friday 2026 live across the EU stores and compare France, Italy and Spain.
The full Amazon Ads Report EU 2026 with every analysis: Download the report
Frequently asked questions about Amazon advertising in the EU
How many ads run on Amazon in the EU?
On October 26, 2026, 91.5 million ads ran across the nine EU stores on a single day. Over twelve months, Amazon’s EU archive holds 1.36 billion ads. amazon.de alone accounts for 31.8 million running ads a day and 786,000 new ones.
What is the Amazon Ad Library?
It is Amazon’s public ad repository under Article 39 of the Digital Services Act. It lists every ad shown in the EU stores until one year after it was last shown, with advertiser, payer, product, run time and impressions. It contains no budgets, clicks or sales.
Does the archive cover amazon.com or amazon.co.uk?
No. It covers the nine EU stores: Germany, France, Italy, Spain, the Netherlands, Poland, Sweden, Belgium and Ireland. The UK and Turkey are not included, and neither is the US.
Can I see my competitors’ ads in the archive?
Yes. You can see which products a competitor advertises, since when the ads have been running, roughly how many impressions they’ve had and whether an agency runs them. You can’t see bids, keywords or budgets.
Where can I get the full report?
You can download the Amazon Ads Report EU 2026 for free. Its 25 pages cover every analysis, the agency ranking and the method.
How reliable are these numbers?
The counts come straight from Amazon’s archive. Impressions are lifetime values in ranges and aren’t a measure of budget or sales. Payer origin, brand and agency mapping are based on samples and name searches, so treat them as good approximations, not a full census.
Subscribe to Newsletter
Get the latest Amazon tips and updates delivered to your inbox.
By subscribing you agree to our Privacy Policy .


