Amazon Inventory Health Report: Complete Guide for Vendors
Trutz Fries
The Amazon Inventory Health Report from Amazon Brand Analytics is an essential tool that provides vendors with critical insights into their inventory status. Understanding and utilizing this report effectively helps maintain optimal stock levels, prevent costly stockouts, and improve your product rankings on Amazon. After all, a “healthy” inventory is the cornerstone of a thriving Amazon business.
Why Amazon Inventory Health Report Matters for Vendor Success
When items are out of stock on Amazon, it can have a long-term negative impact on a vendor’s search result rankings and future sales. Amazon relies on many factors when providing search results to your customers, and product availability plays an important role in your search ranking algorithm.
Using the “Inventory Health” report, you can determine which items Amazon no longer has in stock. In addition, if you compare this with the open orders, you can determine which items Amazon has “lost interest in”. If you encounter surprises here, then there is a need for action. Out-of-stock situations also give you reason to review internal processes. Are orders not being accepted on time? Or is there a hitch in shipping?
Understanding Distributor View and Program Selection in Inventory Health Report
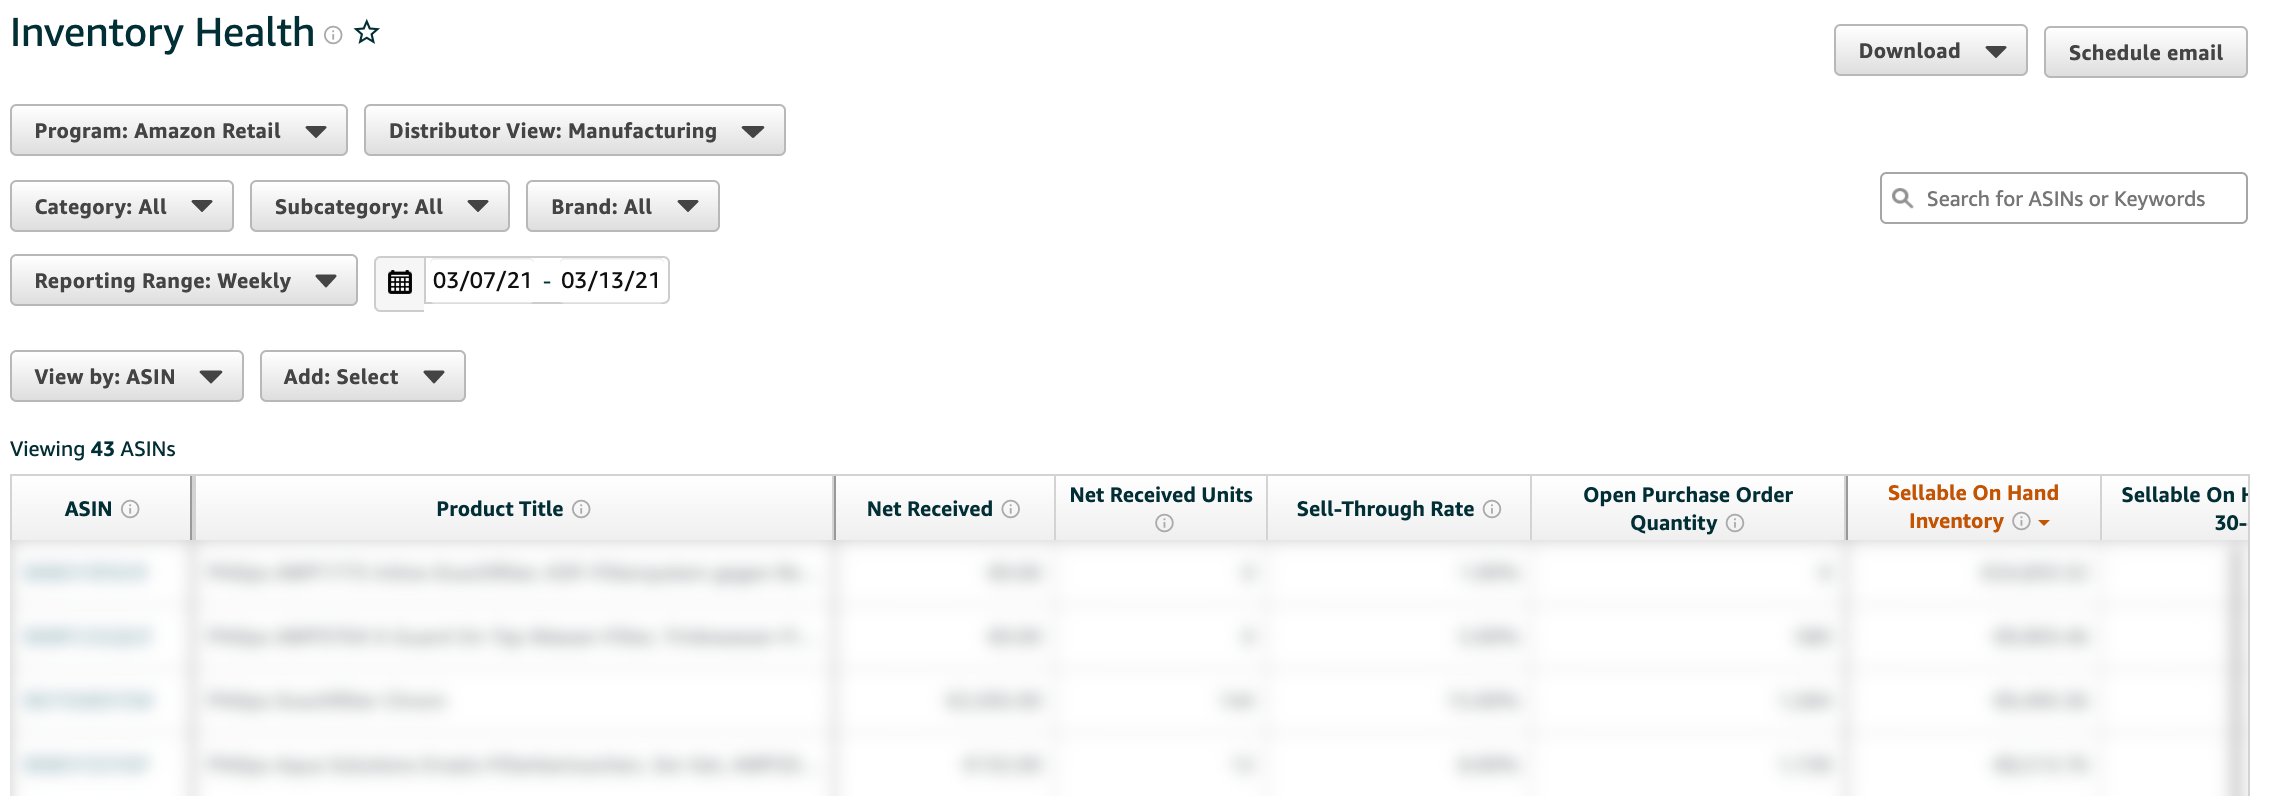
Depending on the filtering, the Inventory Health report shows different key figures. The default setting for Program is Amazon Retail . You can also still select Amazon Prime Now as a program. Amazon Prime Now is a delivery service that delivers products within 1-2 hrs. However, the service is currently only offered in a few cities.
In addition, the Distributor View can also be configured.
The default setting for this is Sourcing. Sourcing metrics refer to sales and inventory that Amazon has sold and sourced from your inventory only.
In addition to Sourcing, you can also select Manufacturing (Manufacturing). Normally, manufacturing metrics aggregate sales and inventory for items identified with your brand - regardless of whether Amazon buys the items directly from you as the supplier. However, since this report is based on your inventory as a vendor, the inventory numbers are the same in both views (Manufacturing/Sourcing). The only difference is that there are additional metrics added in the Manufacturing view. You can read about what these are in the following section.
Key Metrics in Amazon Inventory Health Report Explained
In the Inventory Health Report you can filter by a category, a subcategory and a brand, as well as define an evaluation period. Inventory updates are imported on a weekly basis.
The following key figures are displayed depending on the filter settings:
| Key figures | Explanation |
|---|---|
| ASIN | Amazon Standard Identification Number is the unique identifier assigned to all products offered on Amazon. |
| Product Title | The product title of the Amazon product. |
| Net Received | Net Received denotes the net amount received by Amazon after deducting the amount returned to the supplier in the selected period. |
| Net Received Units | Net units refers to the units that remain after deducting the units returned to the supplier in a selected time period. |
| Sell-through rate | The sell-through rate is calculated by dividing the number of units shipped by the number of units on Amazon at the beginning of the period plus all units received in the same period. |
| Open Purchase Order Quantity | The open purchase order quantity represents the number of units currently on order. |
| Sellable On Hand Inventory | In Stock Marketable Inventory includes the inventory in Amazon shipping centers that can be sold on the last day of the selected time period (in Euros). Additional key figures: Sellable On Hand Inventory - Trailing 30-day Average (Sellable On Hand Inventory - Trailing 30-day Average): The average value for the last 30 days including the last day for the selected time period. Marketable products in stock (Sellable On Hands Units): The number of units in Amazon shipping centers that can be sold on the last day of the selected time period. |
| Unsellable On Hand Inventory | The Unsaleable On Hand Inventory metric includes inventory in Amazon shipping centers that cannot be sold due to condition on the last day of the selected time period (in Euros). Additional key figures: Unsold, in-stock inventory - average of last 30 days (Unsellable On Hand Inventory - Trailing 30-day Average): The average value for the last 30 days including the last day for the selected time period. Unsellable On Hand Units (Unsellable On Hand Units): The number of units in Amazon shipping centers that cannot be sold due to condition on the last day of the selected time period. |
| Aged 90+ Days Sellable Inventory | Sellable units, older than 90 days denote the inventory in Amazon shipping centers that is at least 90 days old and in saleable condition (in Euros) on the last day of the selected time period. Additional key figures: Aged 90+ Days Sellable Inventory - Trailing 30-day Average (Aged 90+ Days Sellable Inventory - Trailing 30-day Average): The average value for the last 30 days including the last day for the selected time period. Aged 90+ Days Sellable Units (Aged 90+ Days Sellable Units): The number of these units |
| Unhealthy Inventory | Unmarketable inventory means the excess inventory on the last day of the selected period based on the forecasted demand. Additional key figure: Unhealthy Inventory - Trailing 30-day Average (Unhealthy Inventory - Trailing 30-day Average): The average value for the last 30 days including the last day for the selected time period. This key figure is only included in the production view |
| Unhealthy Units | Excess inventory on the last day of the selected period based on forecast demand. This key figure is only included in the production view |
| Replenishment Category | The inventory replenishment category indicates whether or not Amazon will reorder the products again. |
Subsequently, you can generate the data on a daily, weekly, monthly or even quarterly basis. The export of this data works either via a direct export as an Excel workbook or a CSV file. For advanced data analysis techniques, check out our guide on analyzing Amazon Excel data.
How to Use Inventory Health Data in AMALYTIX
If you cleverly combine the Inventory Health report data with the sales diagnostics report, then you can find out, among other things, how long the inventory will last or whether you have too much or too little inventory in relation to your sales.
In AMALYTIX, the Inventory Health report is also used and the key figures are clearly displayed for you. In addition, other key figures are calculated for you with the help of the sales diagnostics report, such as the range of your product in days, in relation to the current sales figures.
Conclusion
The Inventory Health report helps you keep track of the most important inventory metrics at all times. In addition, efficient inventory management helps you keep your products in stock and increase sales. With a good inventory management process, you can strike the balance between satisfying buyer demand and maintaining sufficient inventory.
Subscribe to Newsletter
Get the latest Amazon tips and updates delivered to your inbox.
By subscribing you agree to our Privacy Policy .