Amazon Sales Diagnostic Report: Track Performance Metrics
Trutz Fries
The Amazon Sales Diagnostic Report is the most comprehensive report in Amazon Brand Analytics, providing vendors and sellers with crucial performance insights. This powerful analytics tool tracks sales performance for individual ASINs and categories while analyzing key factors including traffic, conversion rates, pricing impact, and inventory availability. By mastering this report, you can identify exactly what drives your sales performance and discover actionable optimization opportunities.
Understanding Amazon Sales Diagnostic Report Views and Settings
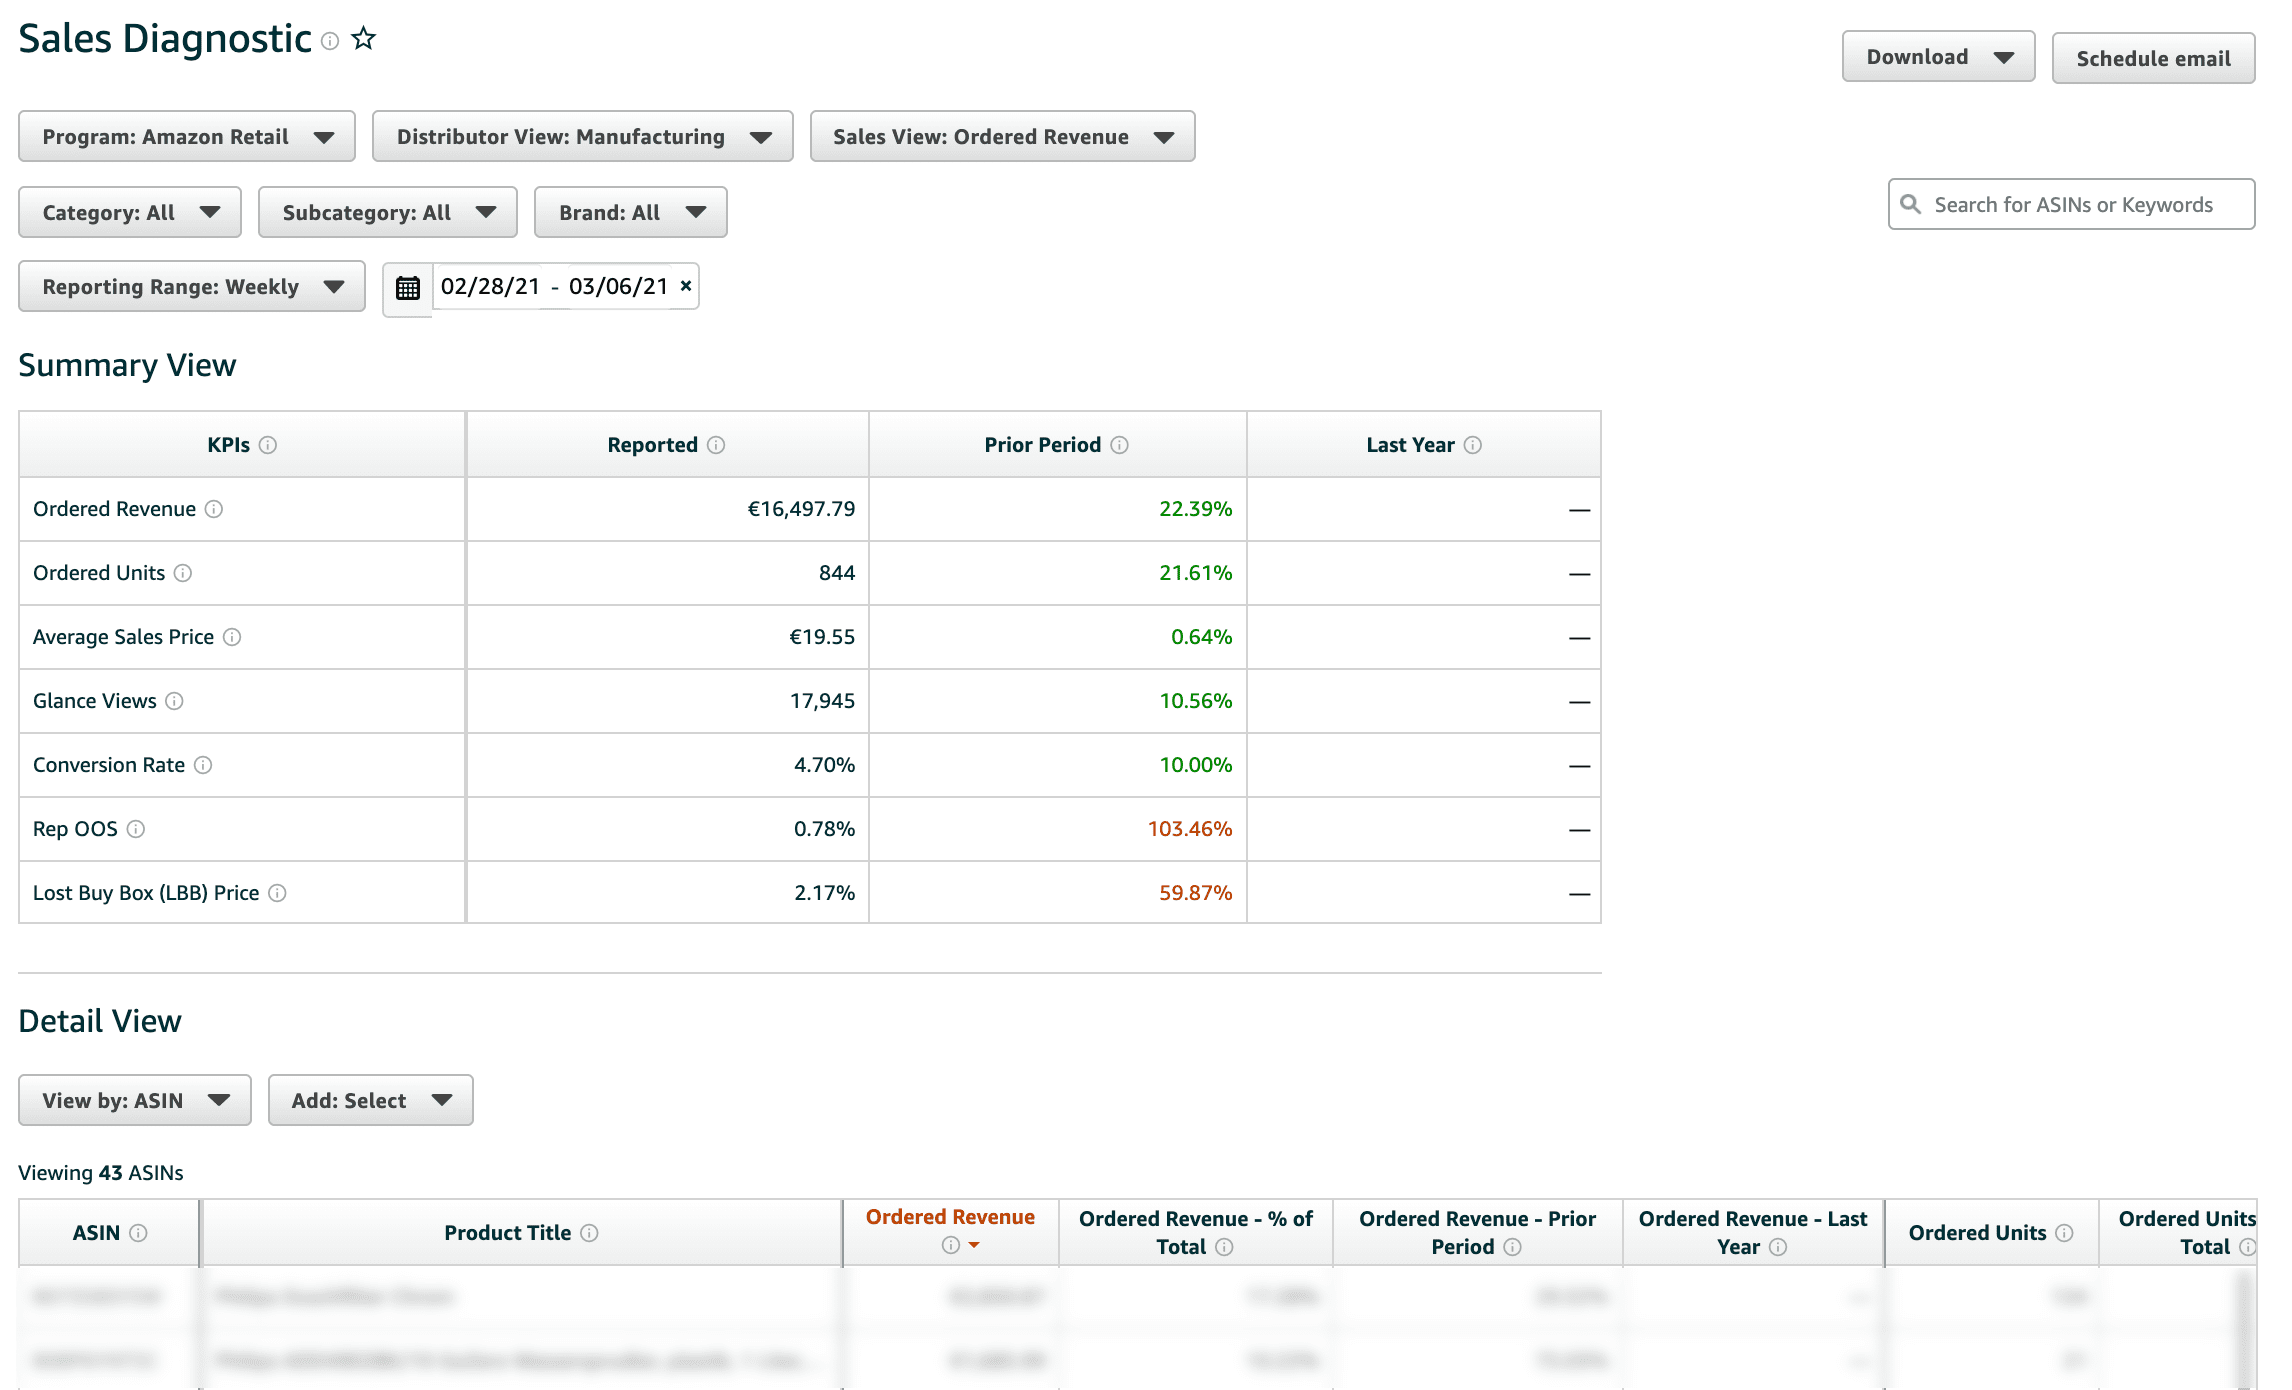
Depending on your filtering, the Sales Diagnostics report displays different metrics. The default setting for Program is Amazon Retail (retail sales version).
As a Seller or Vendor you also have the choice between:
- Amazon Business - is a new marketplace for commercial customers on Amazon.co.uk.
- Amazon Fresh - for fresh food deliveries
- Amazon Prime Now - Prime Now is a delivery service that delivers products within 1-2h. However, the service is currently only offered in a few cities.
Next, you can set the Distributor View. The default setting for this is Sourcing. The sourcing metrics refer to sales and inventory that Amazon has sold and sourced from your inventory only.

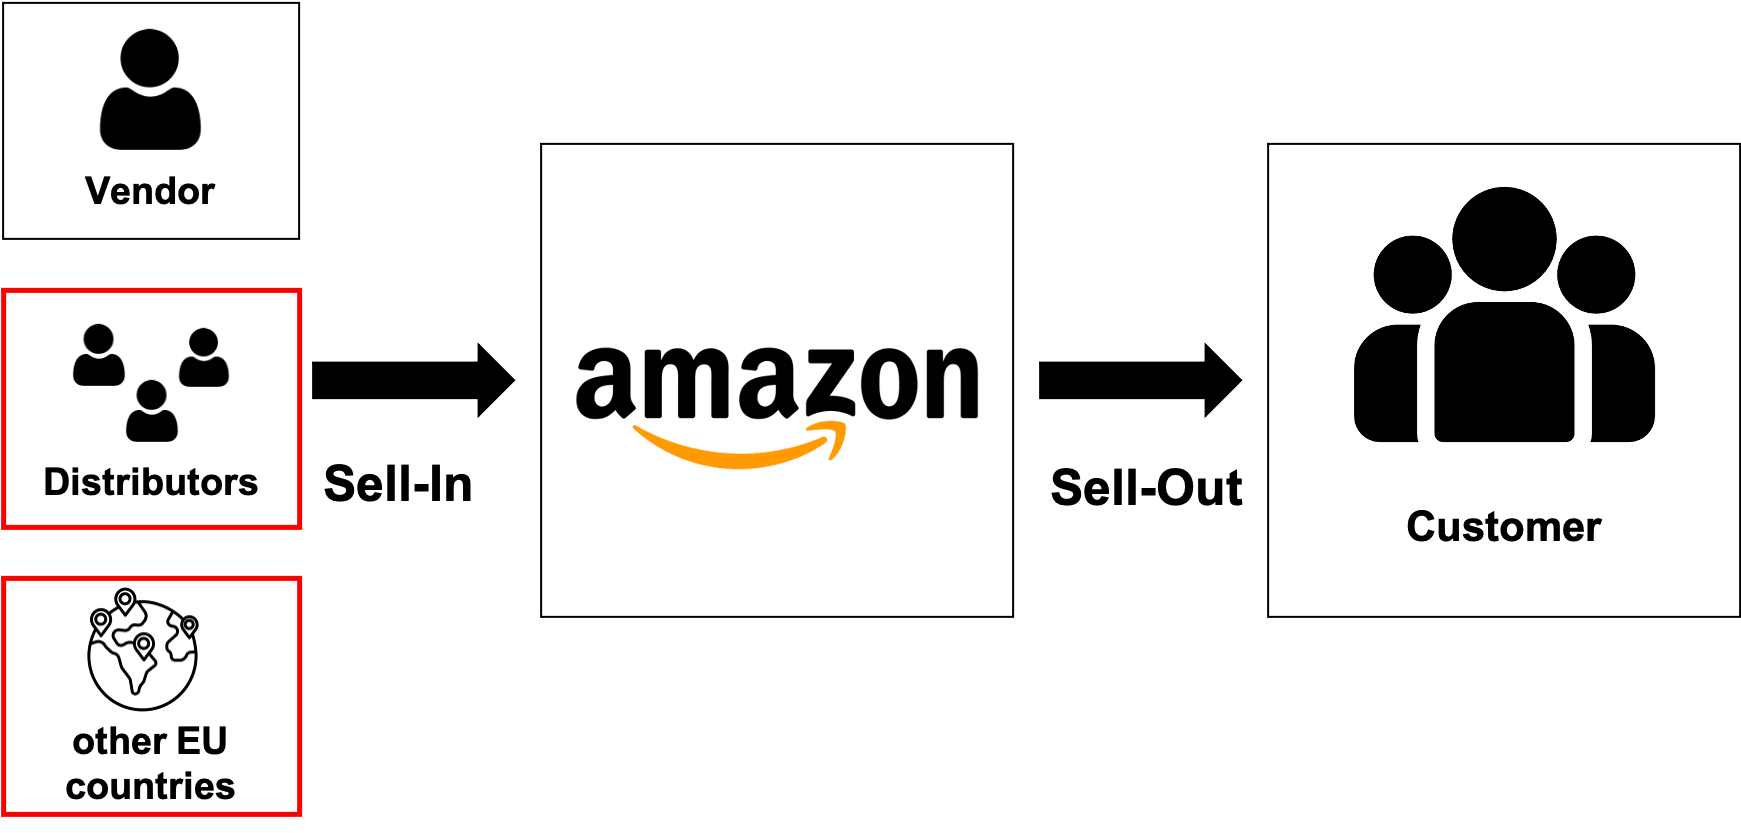
In addition to Sourcing, you can also select Manufacturing. Manufacturing metrics aggregate sales and inventory for items identified with your brand - regardless of whether Amazon buys the items directly from you as the supplier.
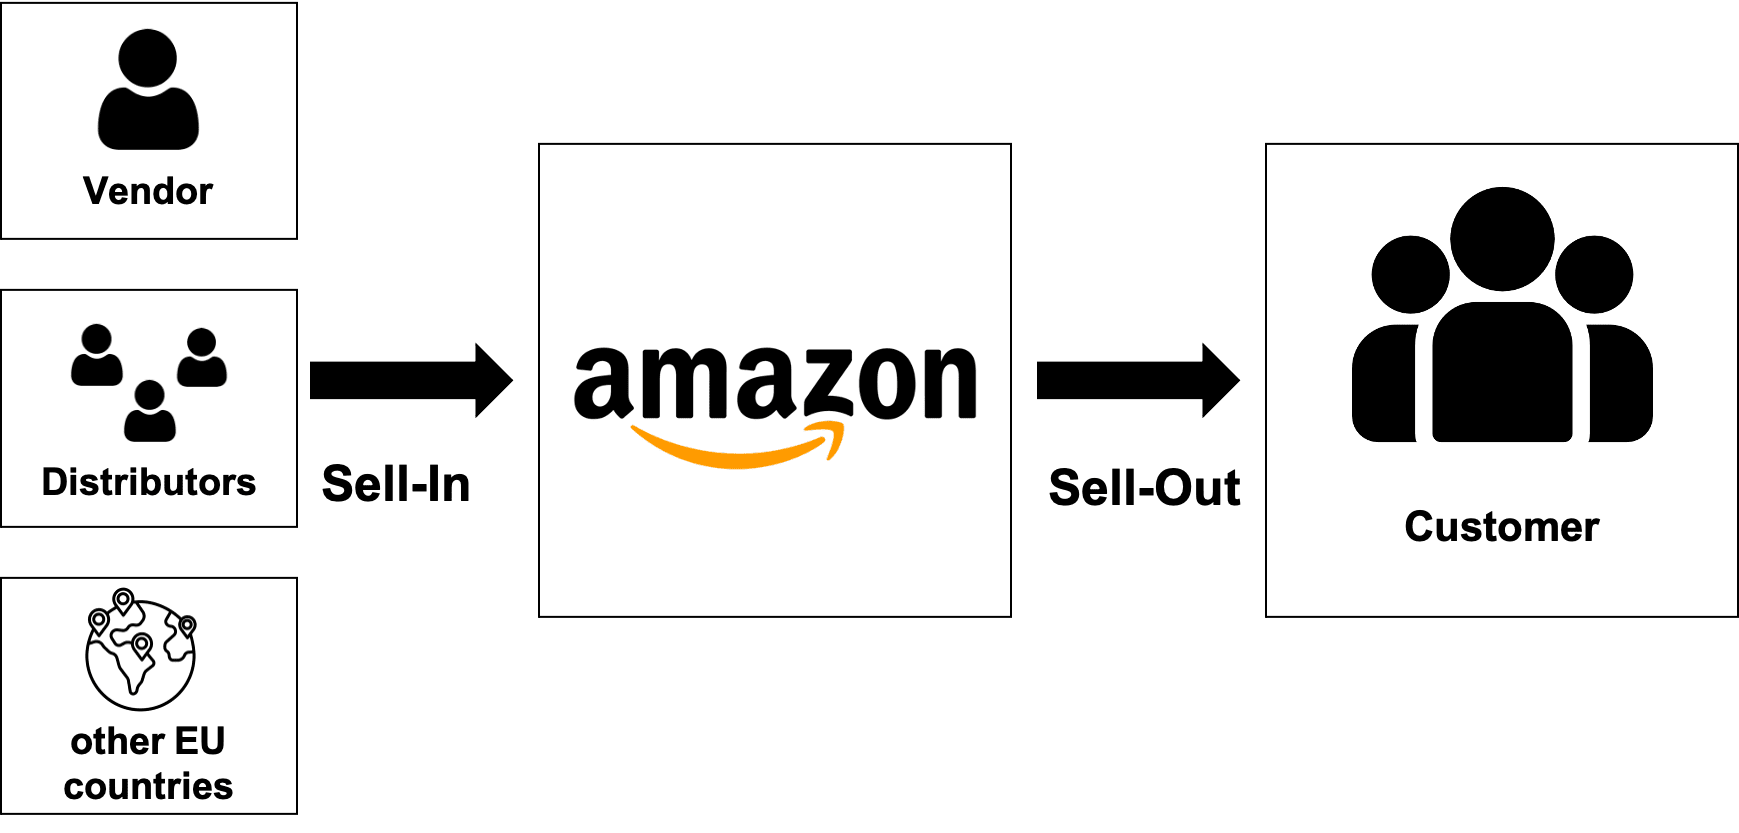
Therefore, the manufacturing view also includes third-party purchases. Third-party sourcing means sales data on units sourced from other distributors and from other dealers in the EU.
The third important setting is the Sales View. Here you can choose between Shipped Revenue, Ordered Revenue and Shipped CoGS.
Sell-Out: How many units of a product are sold to the customer (by the retailer)?
| Sales view | Explanation |
|---|---|
| Shipped Revenue | The Shipped Revenue is the revenue that Amazon makes with your products. It is based on Amazon’s selling price to the customer and the time at which the product was shipped to the customer. The units sold by Amazon are also referred to as sell-out.. |
| Ordered Revenue | Ordered Revenue are the sales that Amazon makes with your products, but at a different time. Ordered refers to the fact that the goods have been ordered but not yet shipped by Amazon. The amount also refers again to the final price. Ordered revenue is therefore also attributable to sell-out. |
| Shipped CoGS | CoGS is the cost of shipped goods incurred by Amazon when purchasing the item from the Vendor. The value cannot be specifically assigned to sell-out or sell-in, because both factors are included. |
Key Metrics in Amazon Sales Diagnostic Report
In the sales diagnostics report, the summary view is always displayed first. It contains a brief overview of the most important key figures for the respective filter selection that one has made in advance. Below that, you can then view more detailed information in the detail view. The table can be filtered by ASIN, subcategory and category for better readability.
The following key figures are always visible, no matter which filter setting was made:
| Key figures | Explanation |
|---|---|
| ASIN | The ASIN is the Amazon Standard Identification Number. The unique identifier is assigned to all products offered on Amazon. |
| Product Title | The product title is the product name of your product. |
| Average Sales Price | The average sales price indicates the average price per shipped unit of your product for the selected period. Additional key figures: Previous period (average price per unit shipped as a percentage compared to the previous time window). |
The following key figures are only displayed depending on the filtering:
| Key figures | Explanation | Filtering |
|---|---|---|
| Glance Views | The page views represent the customer views of the product detail page of your product. Additional key figures: Change in page views compared to the previous period (the percentage change in page views compared to the previous period. (((Current period - previous period)/previous period) x 100)) ; compared to the previous year |
|
| Ordered Units | Ordered units denotes the number of product units ordered by Amazon customers. Additional key figures: % of the total (Displayed percentage of the number); Previous period (Displayed percentage of the number compared to the previous time window); Last year (compared to last year) |
|
| Ordered Revenue | The Ordered Revenue indicates the ordered product sales in a selected period of time. Additional key figures: % of the sum; Last year; Previous period |
|
| Conversion Rate | Conversion rate means the purchase rate of customers viewing your products. |
|
| Free Replacements | The key figure free replacement indicates the number of replacement deliveries sent to customers. |
|
| Lost Buy Box Price | LBB represents the percentage where the shopping cart field (buy box) has been lost to a third party merchant or without another merchant. Customers must then click again on the product detail page to buy your item. |
|
| RepOOS | The RepOOS (Replenishable Out of Stock) metric indicates the percentage of sales that may have been missed because the item was out of stock when it could have been replenished. wue Replenishable Out of Stock. The metric is calculated as follows: (page views when the product was out of stock / total number of page views). * 100 Additional key figures: % of the sum; Previous period |
|
| Subcategory (Sales Rank) | Here the sales rank in a subcategory is displayed. |
|
| Shipped Revenue | Shipment yield is the revenue based on units shipped in a selected time period. Additional key figures: Turnover of shipped units - % of total; Previous period, Last year |
|
| Shipped Units | The units shipped are the number of product units shipped to Amazon customers. Additional key figures: % of the sum; Last year; Previous period |
|
| Customer Returns | Goods returned by customers are the number of units returned by customers. |
|
| Shipped COGS | Shipped CoGS is revenue based on the cost of goods sold. This refers to the costs incurred by Amazon when purchasing the item from the vendor. Additional key figures: % of the sum; Last year; Previous period |
|
Conclusion
The Amazon Sales Diagnostic Report provides comprehensive insights into the metrics driving your sales performance on Amazon. By leveraging this powerful tool alongside other reports like the Inventory Health Report and Repeat Purchase Behavior analysis, you can quickly identify performance drivers, optimize conversion rates, and make data-driven decisions to grow your Amazon business. Regular analysis of these metrics is essential for maintaining competitive advantage and maximizing revenue potential.
Subscribe to Newsletter
Get the latest Amazon tips and updates delivered to your inbox.
We respect your privacy. Unsubscribe anytime.