Amazon Product Opportunity Explorer: Find Profitable Niches
Trutz Fries
In October 2021, Amazon introduced the Product Opportunity Explorer. The Product Opportunity Explorer is a tool that divides the existing offer on Amazon into niches and displays key figures for each niche, such as the click share, the average number of reviews, the average selling price, etc. In addition, the Product Opportunity Explorer makes it clear what Amazon customers are looking for. The tool shows, for example, which search terms customers enter in the search bar and which products they click on after searching. Thus, specific sales niches can be evaluated and assessed.
On the one hand, you can use the tool to check whether a product launch in a niche is promising or whether numerous providers are already serving customer demand. On the other hand, you use the tool to perform a competitive analysis. You check how competitive a niche is and how your own market share compares to the competition. You can see who the dominant sellers are, at what prices they sell their products, etc.
In this article, we will explain what the Product Opportunity Explorer is, how you can easily identify market gaps and which application possibilities the tool bring along beyond that.
What is the Amazon Product Opportunity Explorer?
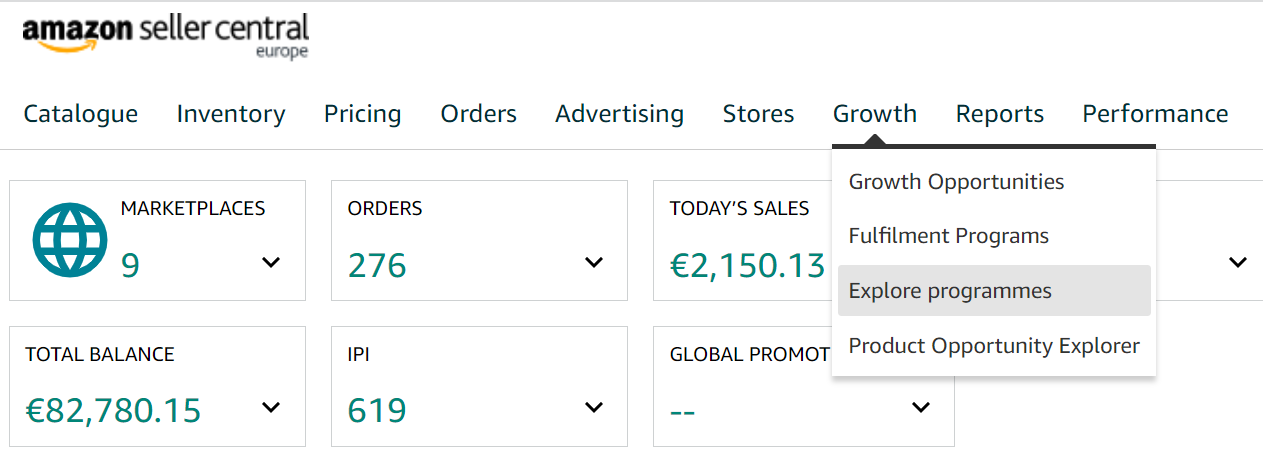
To find the tool, click on “Product Opportunity Explorer” in Seller Central under “Growth”:
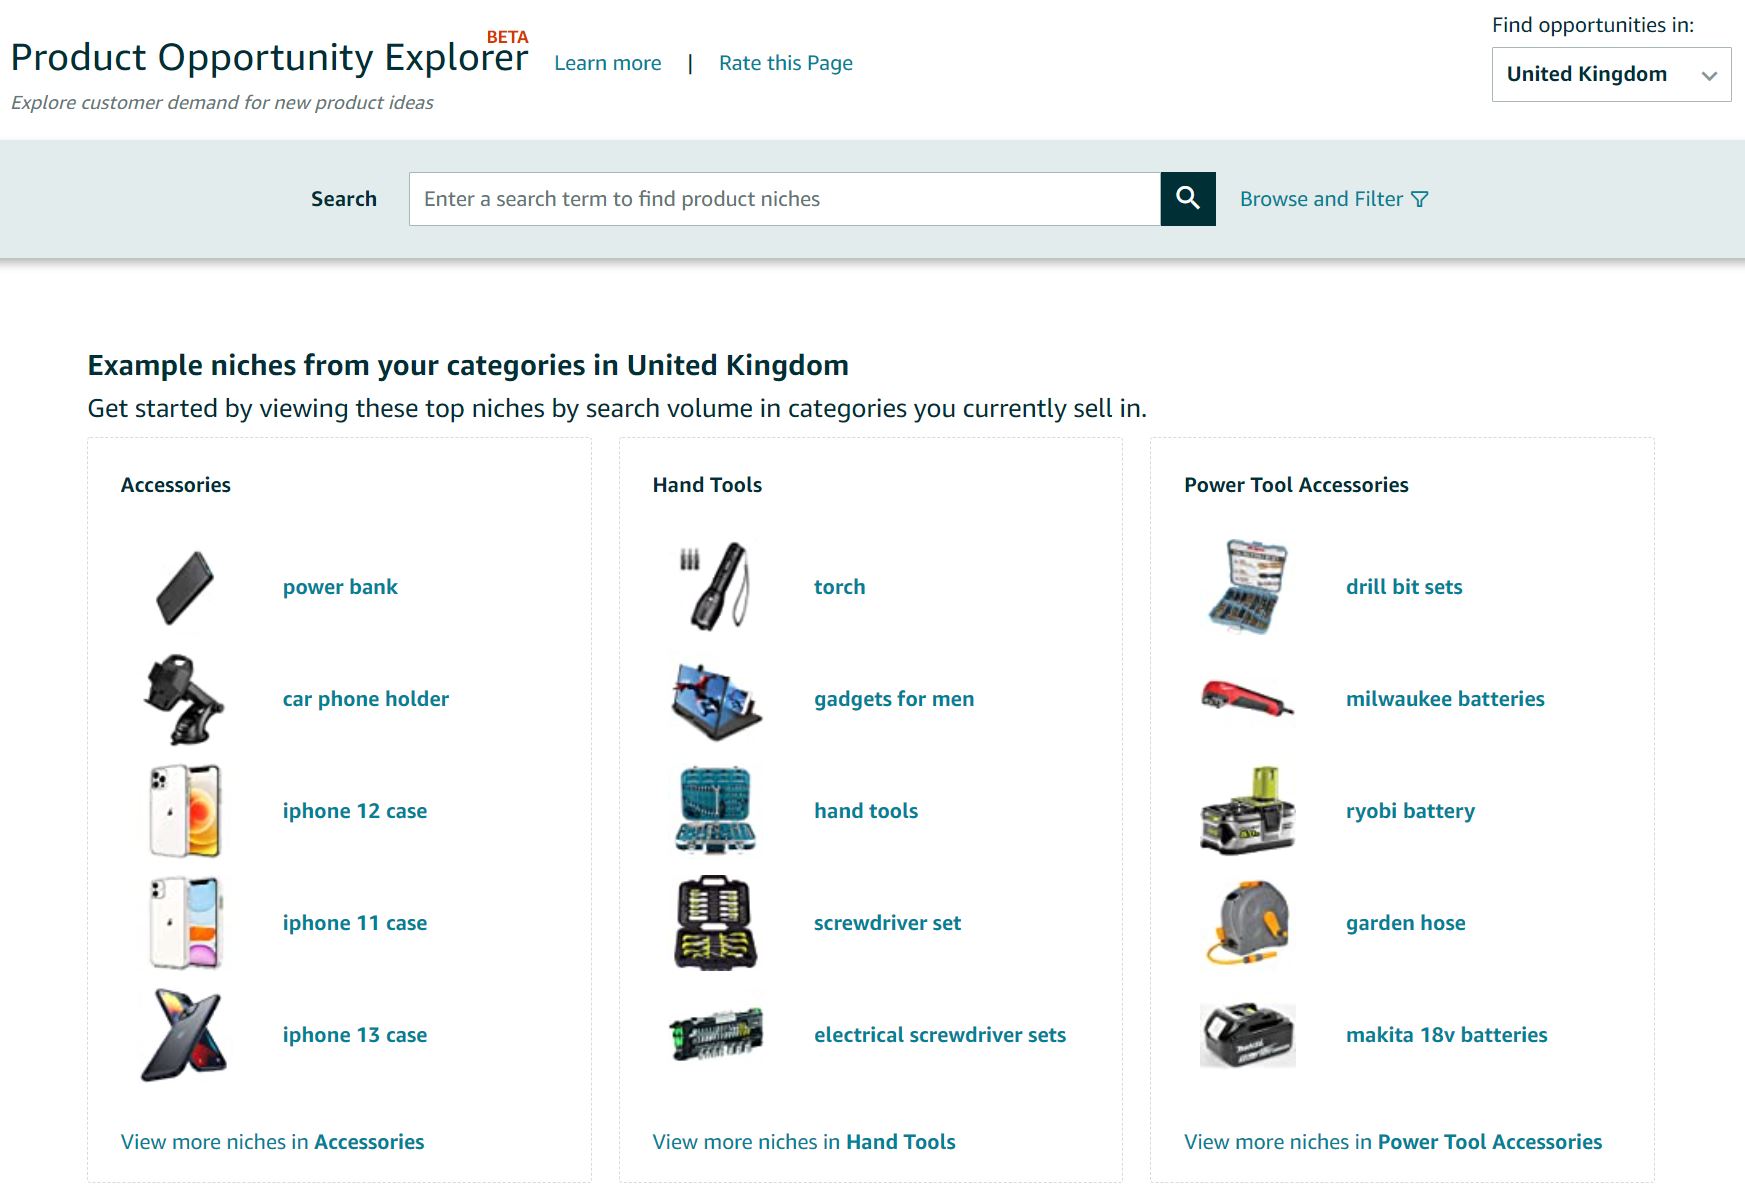
You will be taken to a page where you will be shown three sample niches. At the top right you have the option to choose between the marketplaces United States, Germany, United Kingdom, France, Italy and Spain. Below you will see a search bar where you can search for specific search terms:
If you do not want to search for a search term, click on “Browse and Filter”. Categories will be displayed for you to click through:
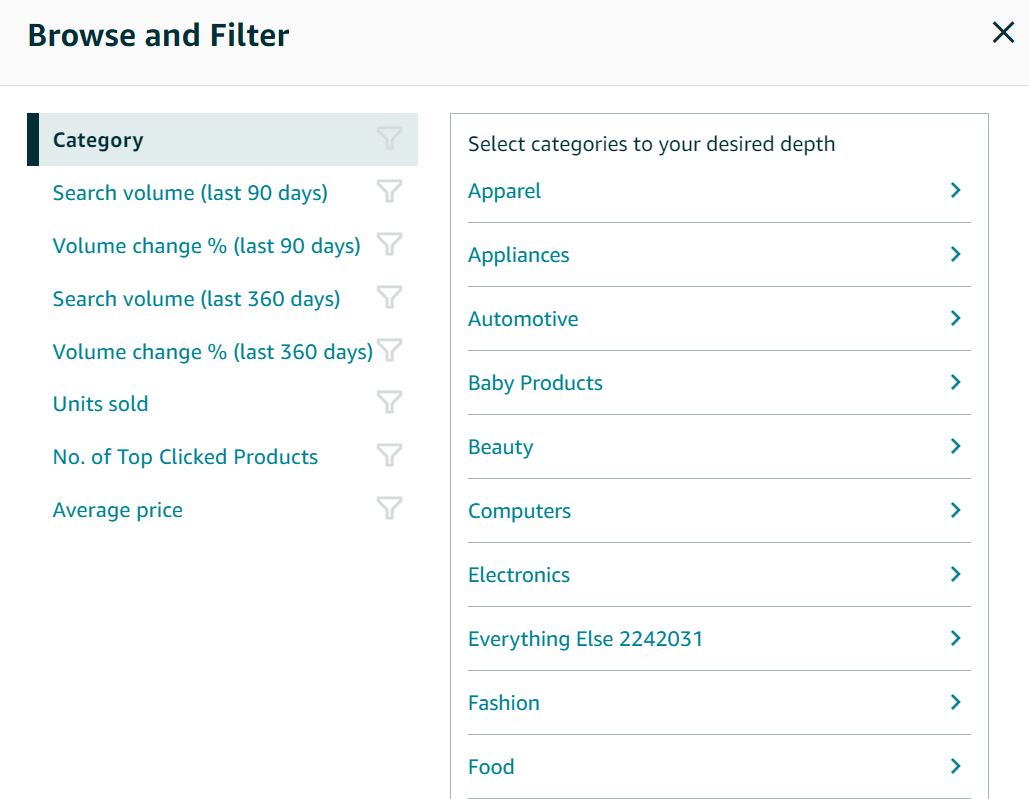
The product categories correspond to the categories that Amazon customers also click through when searching. You can also filter by search volume (90 days, 360 days), volume change (90 days, 360 days), units sold, number of the top clicked products and average price under “Browse and filter”. For example, if you enter 1,000 as the minimum value for “Units sold”, the results will only show you products that have been sold 1,000 times or more.
To illustrate once again the difference between category, niche and search term: in the category “Accessories” is the niche “Apple Watch”. You can search for Apple Watch using different search terms. Example search terms for this niche are “apple watch”, “apple watch 6” or even “iwatch”.
We’ll explain the tool using the niche “coffee machine”. If you click on “coffee machine”, you will first see general information about the niche at the top of the page:
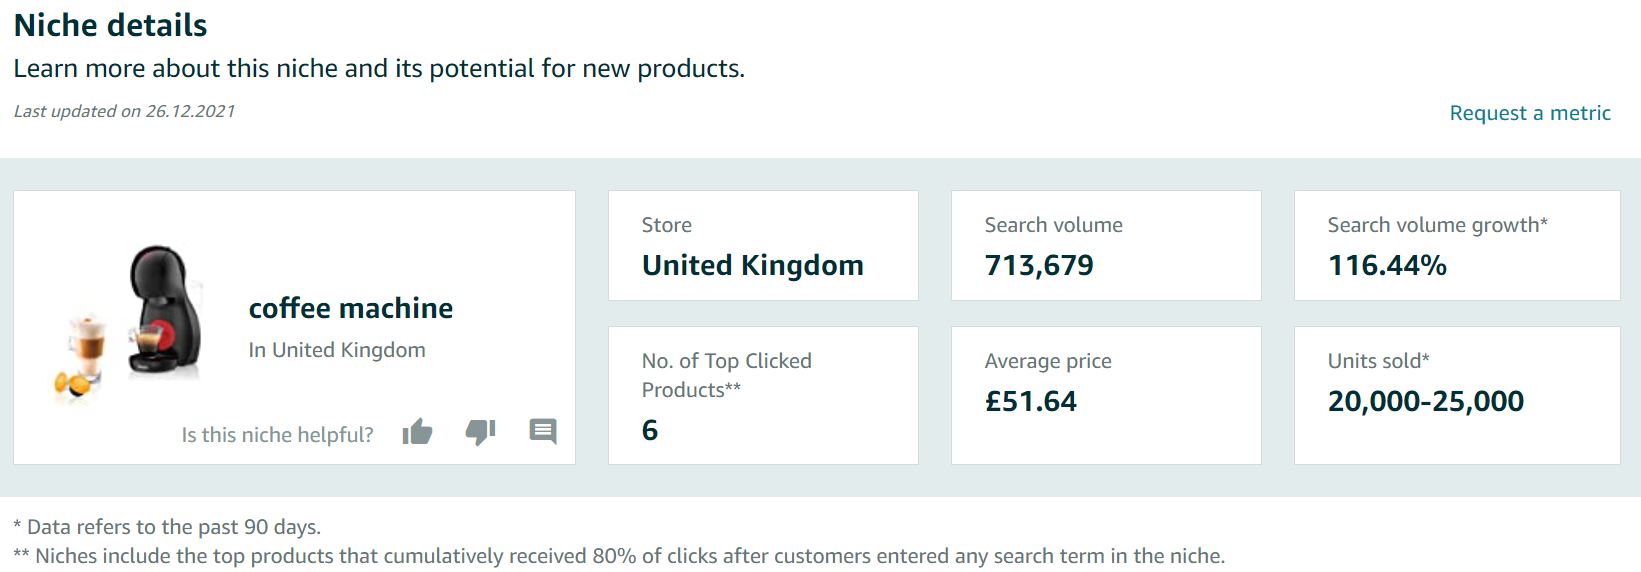
Between 20,000 and 25,000 units of the niche were sold on the marketplace of the United Kingdom in the last 90 days at an average price of 51.64 pounds. Within the last 90 days, 713,679 (search volume) times, search terms of the niche coffee machine were searched for and the search volume increased by 116.44 percent. The growth of the search volume is an example that some numbers in the tool may not be correct yet. In our estimation, it is very unlikely that coffee machines were searched for twice as often as in the previous quarter.
For each niche that Amazon describes, the data is categorized into three main sections:
- Products
- Search Terms
- Insights
Products
This category displays the products customers clicked on most often after searching for a coffee machine. The tool breaks down the performance of the products by various metrics and compares them to competing products.
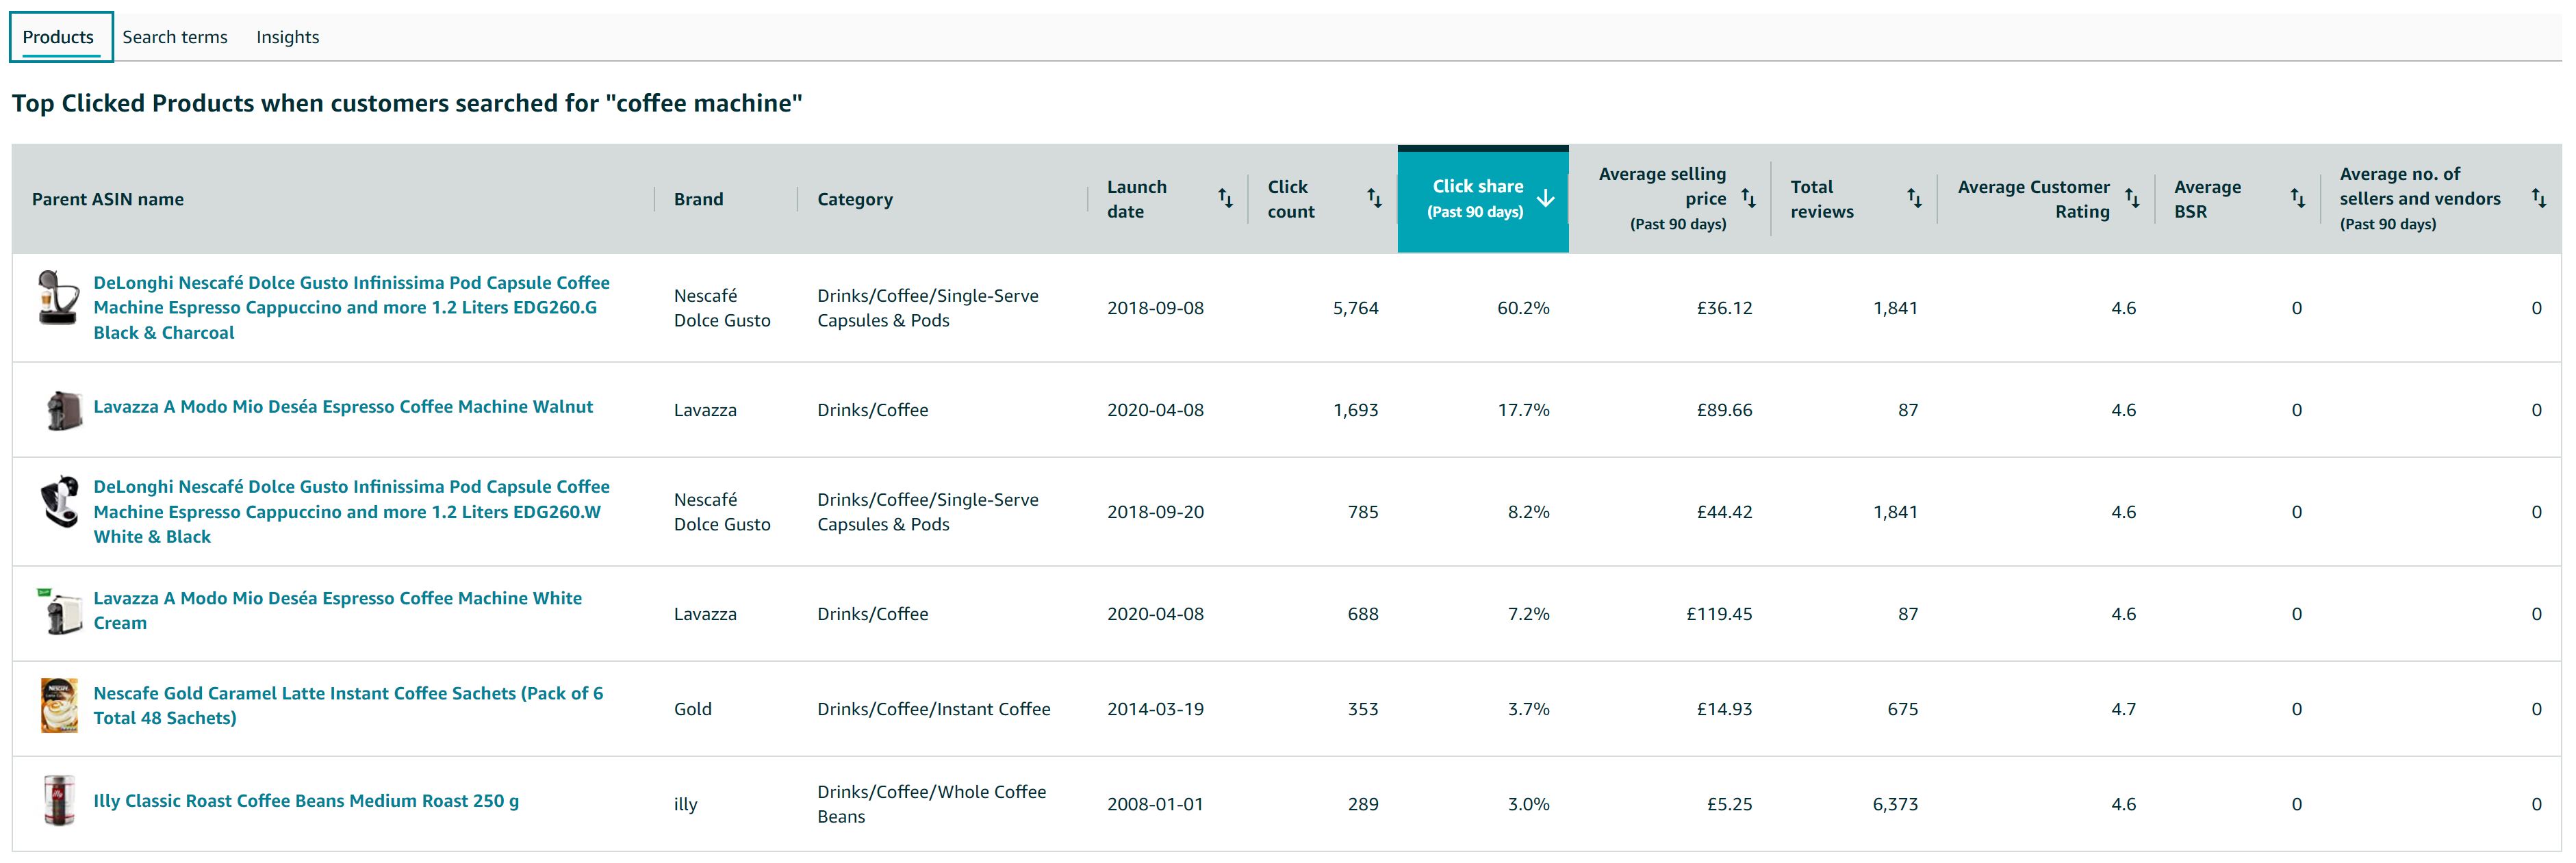
The ranking includes the following factors:
- Parent ASIN name: the column lists the products that are compared. If you click on the link, you will go to the Amazon detail page of the product
- Brand: as the name suggests, the brand of the product is displayed here
- Category: the column shows how Amazon customers click through the category tree until they arrive at the search term
- Launch Date: the launch date describes the date when the ASIN was first sold on Amazon
- Click count: the column indicates the total number of clicks on this product, i.e. how many customers have already clicked on this ASIN
- Click share: the column indicates the number of clicks on this product, relative to the total number of clicks. The number thus indicates what percentage of the total clicks this product has received
- Average selling price: the column shows at what average price all products in this niche are sold for
- Total reviews: the column tells you how many reviews a product has received so far. However, only reviews with text are counted. Pure star ratings are not taken into account in this figure
- Average Customer Rating: the average Customer Rating describes how customers have perceived and rated the product on average. Again, only ratings with text are considered, not simple star ratings
- Average BSR: BSR is the abbreviation for Amazon Bestseller Rank and indicates how well or less well a product is selling relative to other products in the same category. The product with the Bestseller Rank 1 is the most sold product in the respective category
- Average number of sellers and vendors: the column indicates how many third-party or first-party vendors are selling the product on Amazon
Click on the arrow in the first row to sort the results in descending or ascending order.
The Products section thus provides information on how competitive a particular niche is and how well your own products perform compared to competitors.
In the example of the coffee machine, you can see that the “Delonghi” brand performs particularly well. Of all customers who searched for a coffee machine, more than one in two (60,2 percent click share) clicked on the Delonghi coffee machine.
Search terms
This category analyzes which search terms customers enter to reach a desired product. The tool breaks down the relevance of the search terms according to various metrics.
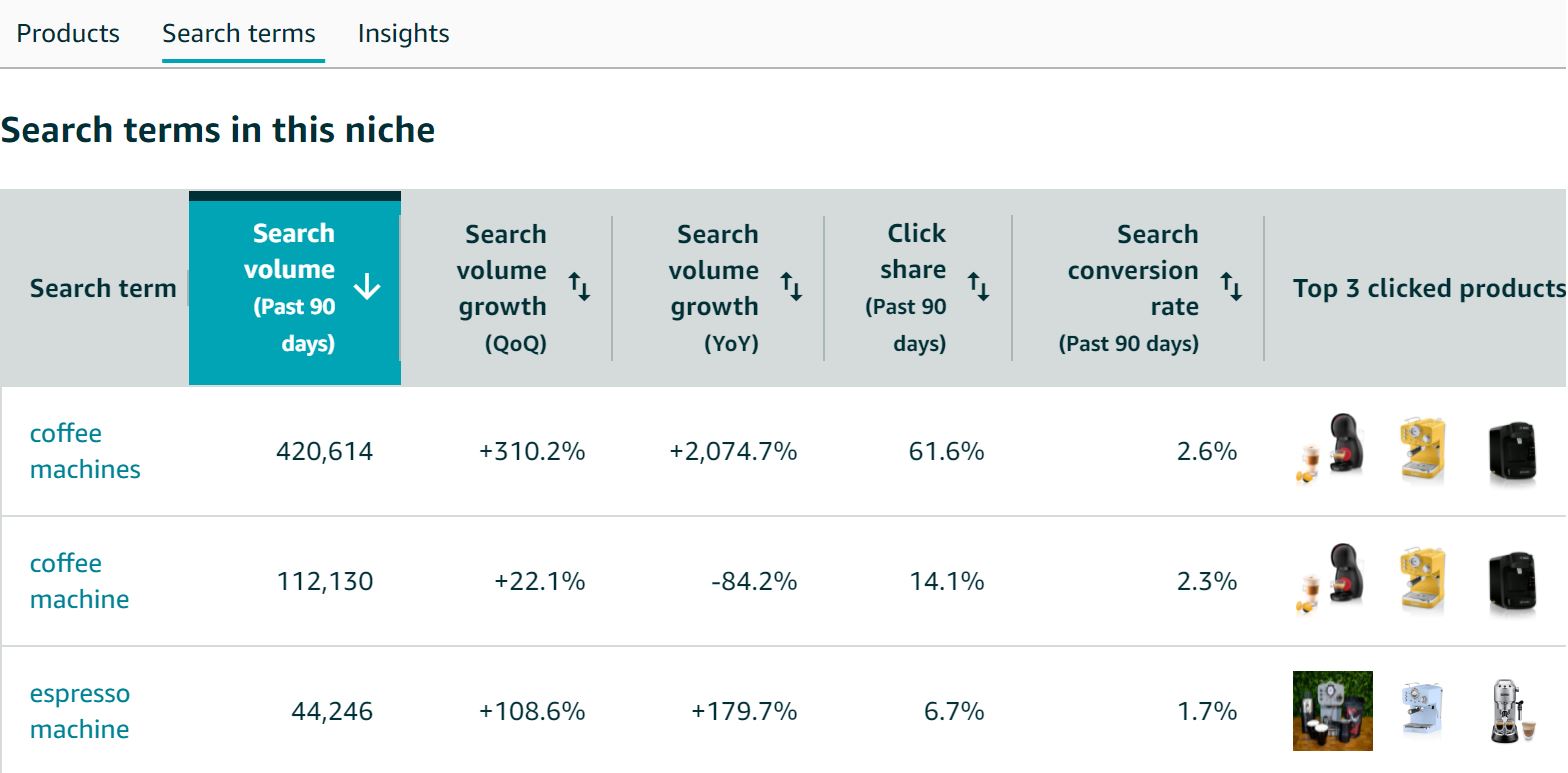
The ranking includes the following aspects:
- Search Term: the search term that customers enter when they want to buy a product in this niche appears in the column
- Search volume: the search volume indicates the number of customers who entered the search term in the Amazon search bar in the last 90 days
- Search volume growth (QoQ): QoQ stands for “quarter over quarter” and thus for quarterly comparison. The quarterly comparison describes the relative change in search volume for this term in the last quarter compared to the previous quarter
- Search volume growth (YoY): YoY stands for “Year over Year” and thus for year-over-year comparison. The value indicates the relative change in search volume for this term compared to the previous year
- Click share: in this column you can see the number of clicks on products from customers who entered this search term. The value is given as a percentage of the total number of clicks from customers for all search terms in this niche
- Search conversion rate: The conversion rate indicates the percentage of customers who order a product after clicking on it. In other words, how many visitors to the product detail page actually bought the product afterwards.
- Top 3 clicked products: this column links the ASINs of the three products that were clicked on most often after entering the search term.
Based on the data, you can identify product opportunities within a niche and recognize keywords with a high search volume.
In the example of the coffee machine, you can see a high search volume for the search term “coffee machines” and “espresso machine”. From the low conversion rate, it can be concluded that customers look at the product several times before making a purchase.
Insights
In the last category you get very specific information about the niche “coffee machine”. Here you can see how the niche has changed over time.
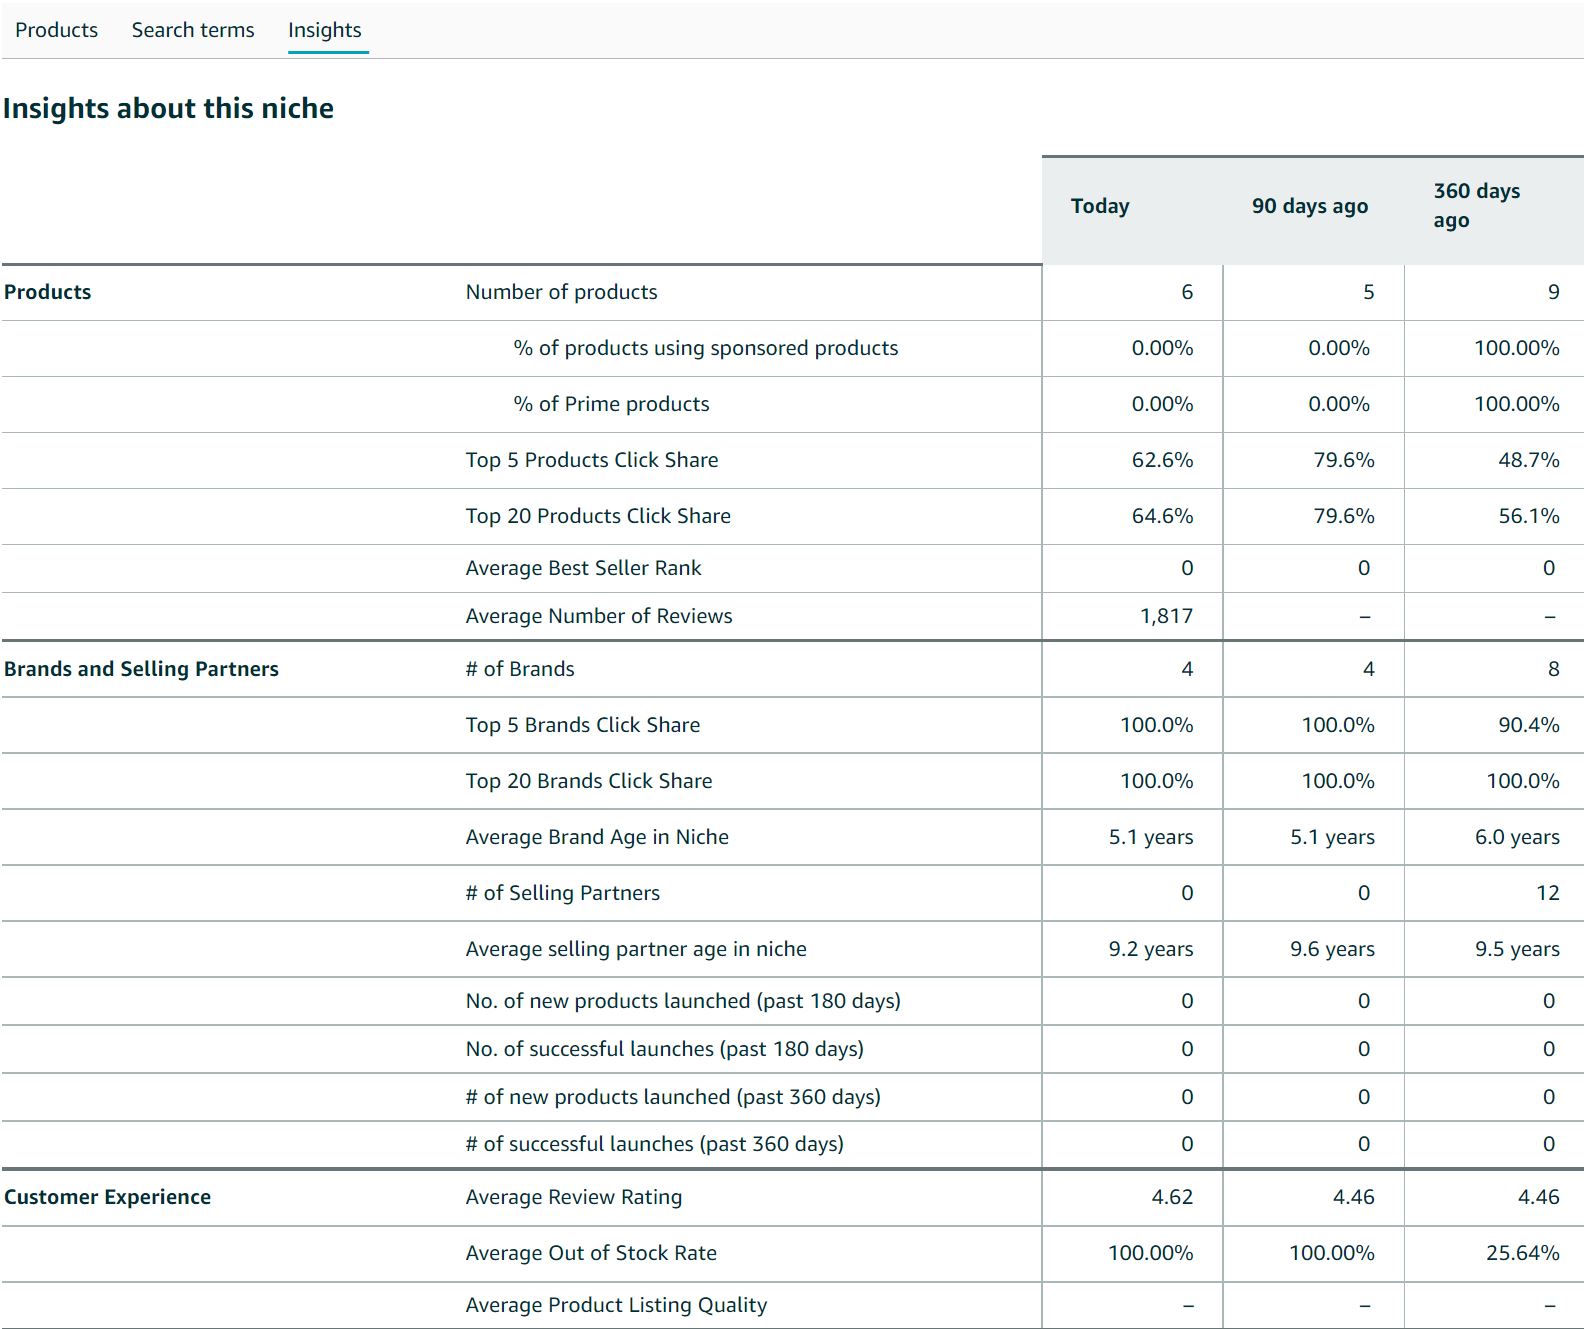
The ranking includes the following factors:
- Products: The Products row tells how many products within a niche are currently offered and have been offered in the past. You can see what proportion of the products are available via Prime and what proportion of the providers run Sponsored Products campaigns. The Click Shares indicate what percentage the top 5 or top 20 products make up. For example, if the Top 5 number is 80 percent, then eight out of ten people click on one of the Top 5 products. The value explains how concentrated the competition is and how distributed the demand is in the niche
- Brands and Selling Partners: this row shows you the number of brands as well as the click-through rate of the top 5 or top 20 brands. In addition, you can see the average brand age, the number of sales partners, the number of new products launched in the last 180 and 360 days, and the number of successful launches. Successful launches are product launches with annual sales of more than $50,000 US. A low number of new product launches combined with a high number of successful launches in the previous quarter is a good sign of high demand and still low supply
- Customer Experience: in this row you can see the Average Review Rating, the Average Out of Stock Rate (OOS), and the Average Product Listing Quality. The OOS rate describes the number of days products were out of stock compared to the total number of days the products were offered. For example, if the OOS rate is 4 percent, then the products were out of stock four days out of 100. Unfortunately, how Amazon measures the quality of product listing is not stated
Based on this data, you can see how high the demand and supply is within the niche. Thus, you can discover optimal niches for new product launches.
In the example of the coffee machine, you can see that the supply and thus the competition are very high. All products are available in Prime and almost all providers run Sponsored Products campaigns. The high number of positive reviews of previous products and the high average quality of product listings makes product launches difficult.
The Product Opportunity Explorer presents the offer on Amazon in concrete numbers. Thus, as an alternative to the search terms report, you have the possibility to search for product opportunities. Unlike the Amazon search terms report, however, you do not search for individual products or keywords, but for so-called niches and search terms. In addition, you can use the tool to perform a competitive analysis by comparing metrics such as the average bestseller rank or the average star ratings of your products with those of competitors. To enhance your analysis further, learn how to leverage the Search Query Performance Report for deeper keyword insights.
How do I get access for the Product Opportunity Explorer?
The tool was launched in October 2021, but since then not every Seller has been granted access.
Prerequisite to use the tool:
- You are Amazon Seller on the German, American, British, Spanish, Italian or French marketplace
- You have registered your brand with the Amazon Brand Registry. You read how to apply and register your brand in our article on Amazon Brand Registry
Even if you meet the requirements, you may not have been granted access yet. If you don’t see Product Opportunity Explorer in Seller Central, you can request access by sending an email to opportunity-explorer-request@amazon.com along with your seller ID. According to experience reports, it takes about two weeks for Amazon to unlock the tool for you.
Advantages of the Product Opportunity Explorer
As described, Amazon’s Product Opportunity Explorer is the first to reveal detailed information about customer search behavior. You can use the data to your advantage in a variety of ways:
- To develop new product offerings, Amazon sellers need current market data as well as past data to analyze customer behavior. With the help of the tool, you can determine whether customers are asking for products that are not yet offered on Amazon. Thus, the Opportunity Explorer helps you develop new product offerings
- If you already have a new product idea, you can use the Product Opportunity Explorer to analyze whether the launch would be beneficial. Under “Insights” you can see the number of reviews, the number of products, how good the average reviews are, etc. If there are already many sellers on Amazon and they have many and good reviews, then launching is difficult or needs special measures
- Clicking on “Insights” again will show you the number of products that use Sponsored Products or are available via Prime. If you sell in a niche where most products are not promoted with Sponsored Products or sold via Prime, you can use that as a competitive advantage
- Under the “Products” tab, you compare products from your brand to competitors’ products. You can compare the number of clicks, average selling price, reviews, and more to copy any competitive advantages your competitors may have
- Under “Search Terms,” analyze search volume growth over time to identify seasonal trends.
- Under “Search Terms,” it’s useful to relate search volume to conversion rate. A high search volume in combination with a low conversion rate, indicates that many customers are searching for a product, but it is not yet offered or not offered in a good quality. Thus, this combination is a sign of a sales opportunity
- Take a look at your brand and category data before optimizing the product detail page and save it. After the optimization you can check if the optimization was beneficial. For example, did the number of clicks or the number of positive reviews change? Understanding Amazon session and conversion data can provide additional metrics to measure your optimization success.
Conclusion
The Product Opportunity Explorer helps Amazon Sellers to grow with up-to-date data on products and search terms. The tool examines customer behavior to highlight where Amazon still has unmet customer demand.
For Amazon, the tool is beneficial because Amazon wants to serve every customer demand and Amazon hopes the tool will help sellers discover and complete market gaps. Sellers benefit from the tool when developing new product offerings and analyzing competition. You can see which niches are not filled yet and can introduce new products there. You also gain insights into the intensity of competition.
More articles, that may interest you:
- Amazon Project Zero - Together Against Trademark Infringements
- Evaluate and Analyze Amazon Session and Conversion Data
- Amazon Concessions Dashboard: Reduce Returns & Refunds
- The “Item Comparison and Alternate Purchase Behavior Report” Explained in Detail
- How to find Amazon Private Label suppliers and import goods
Subscribe to Newsletter
Get the latest Amazon tips and updates delivered to your inbox.
We respect your privacy. Unsubscribe anytime.