Amazon Item Comparison Report: Analyze Competitor Products
Trutz Fries
The Amazon Item Comparison Report and Alternative Purchase Behavior report from Amazon Brand Analytics provide essential competitive intelligence for vendors and sellers. These powerful reports help you understand your competition and customer behavior, including:
- Who are your competitors?
- What products are purchased instead of your product?
- What product is your product most often compared to?
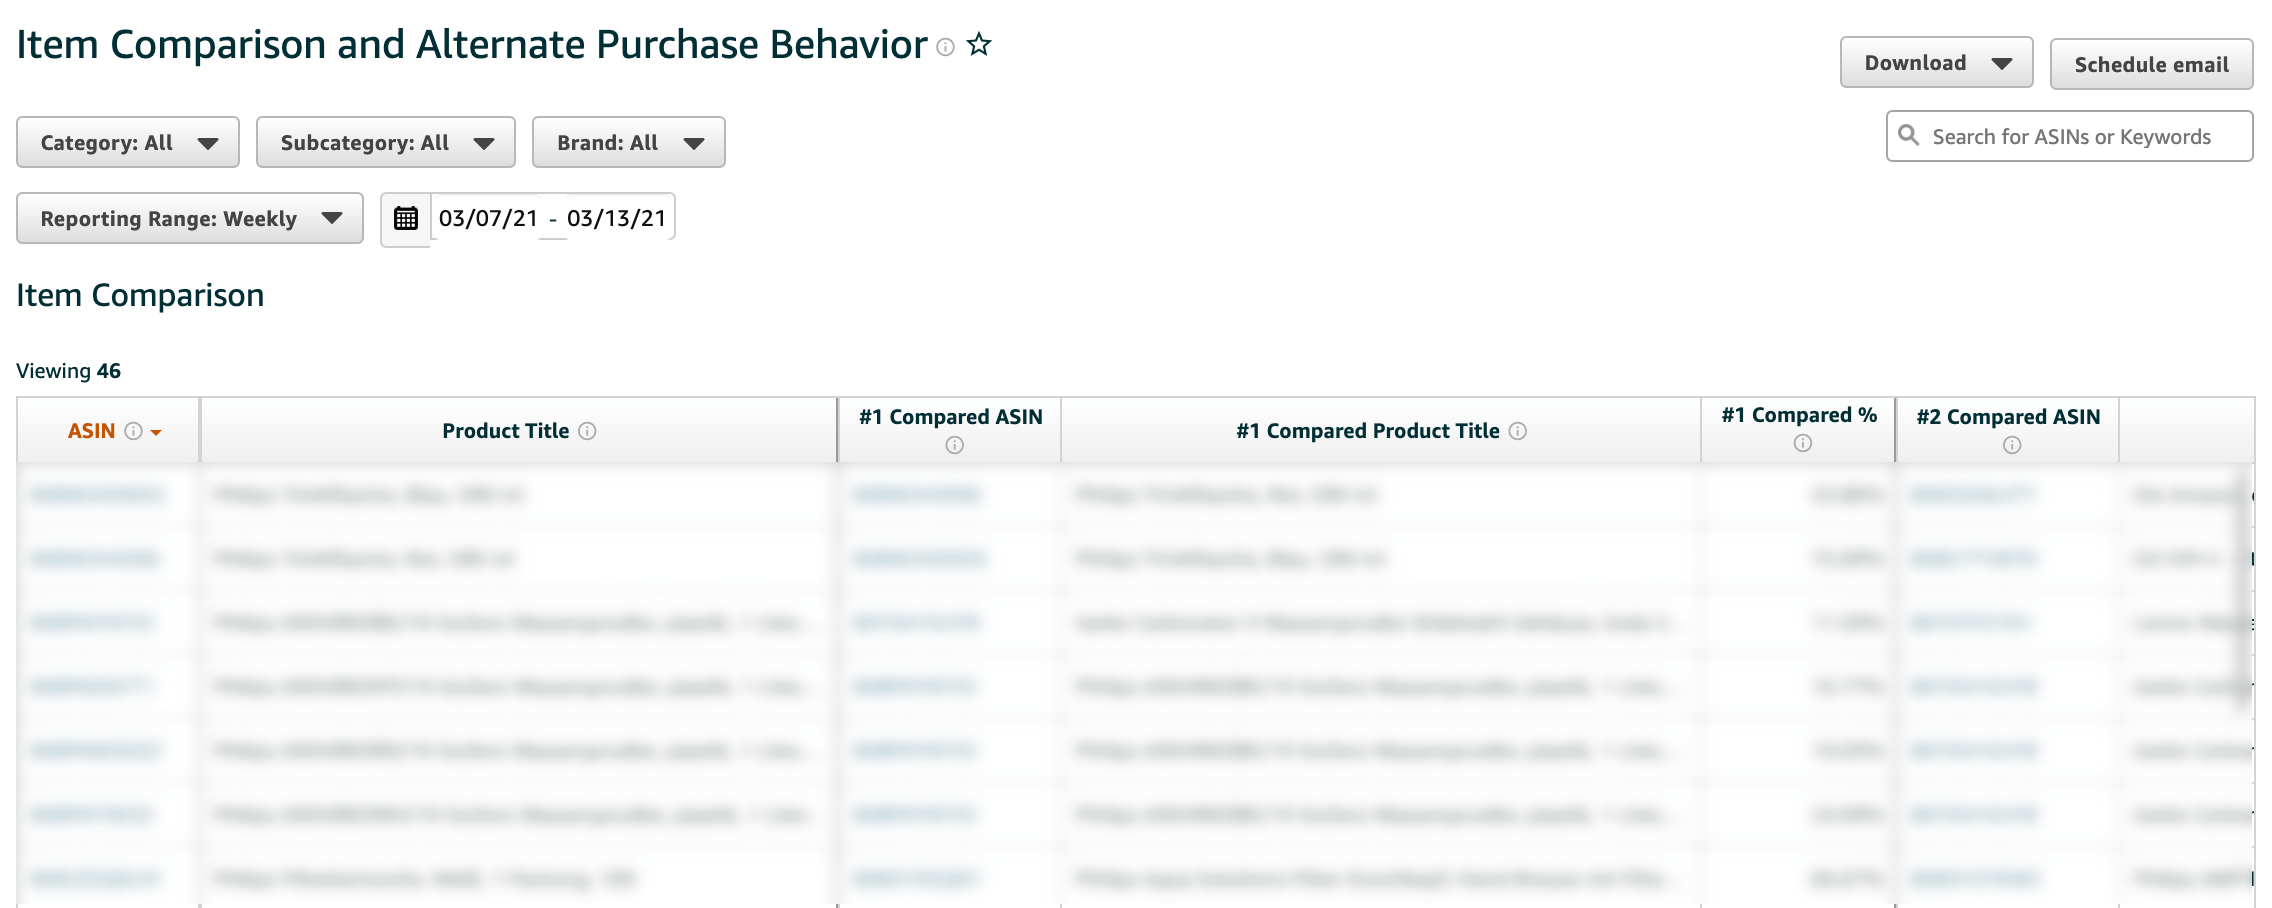
The first report, the Item Comparison Report shows the products that customers on Amazon viewed most often on the same day as your products. This allows you to find out which products are in direct competition with each other.
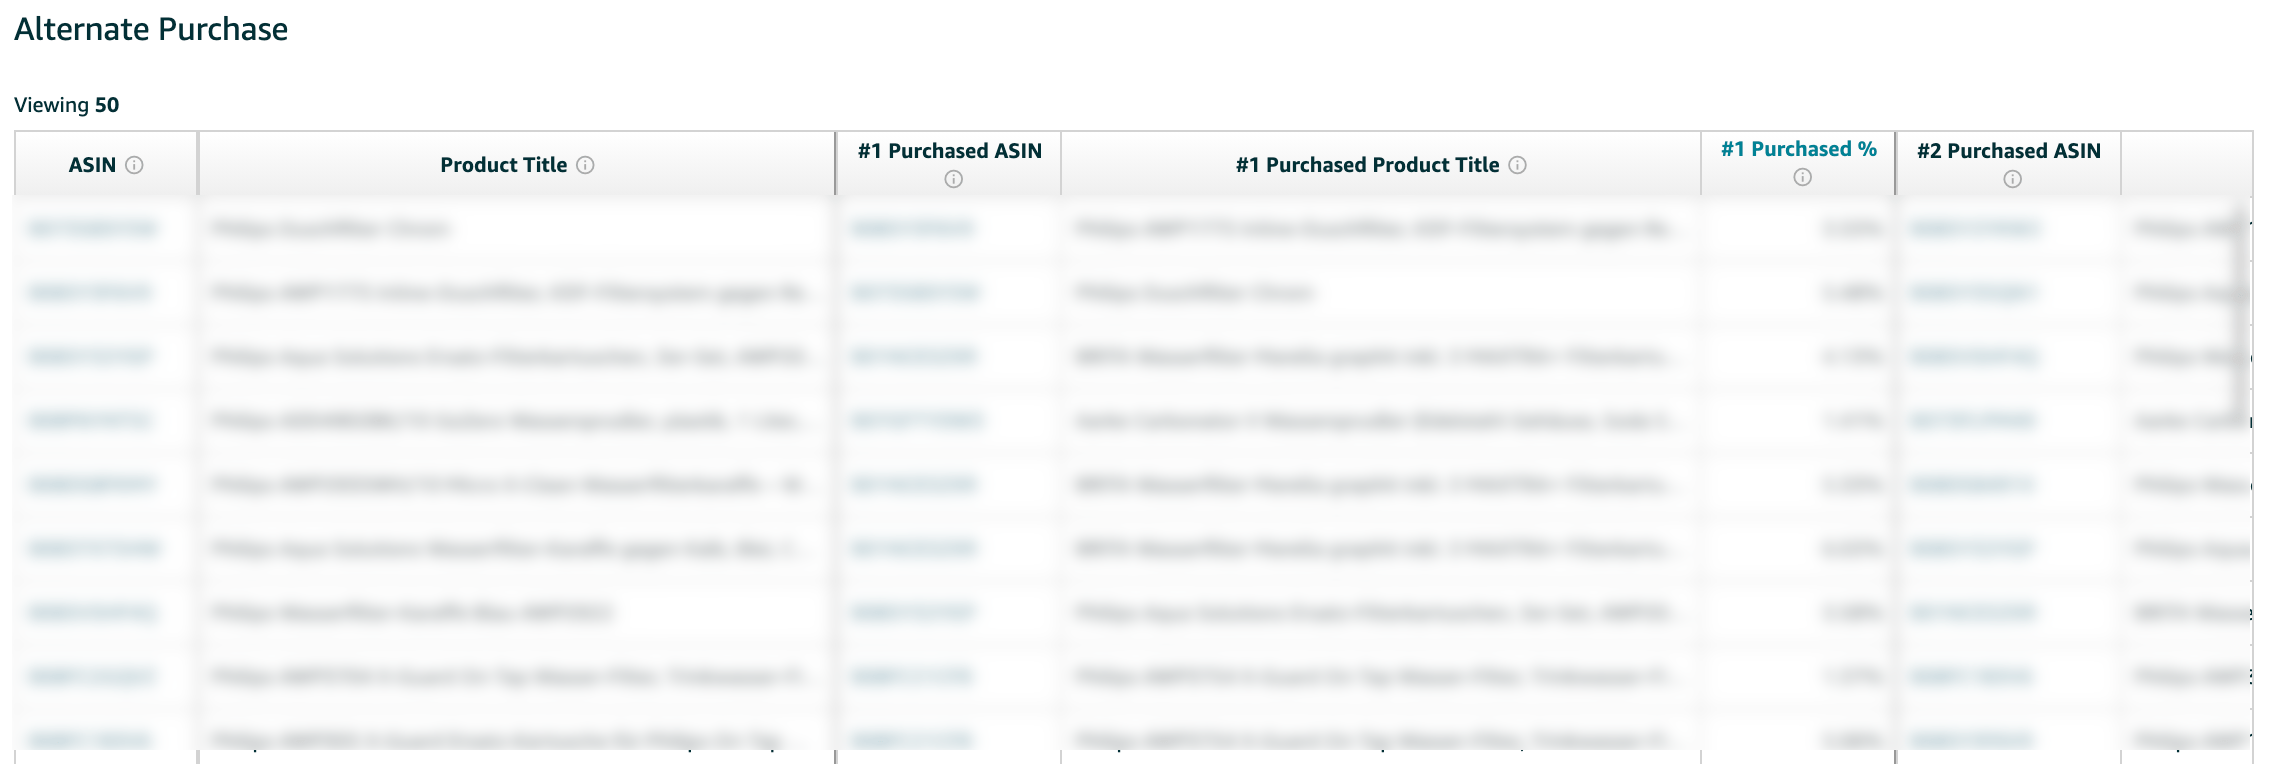
In the second report, the Alternate Purchase Report, you can see how often each product was purchased instead of your own. This allows you to find out the direct competition of the different products.
Understanding Amazon Item Comparison Report Structure
The item comparison report lists your products with ASIN and product title. For each of your products you will be shown 5 other products. These additional products provide information that a potential customer searched for your product, but also clicked on another ASIN/product. Of these other products, the top 5 most clicked products are listed for you. The 5 comparison products are also sorted in descending order. Thus, the product which has been viewed the most after the customers have purchased your product will be displayed at #1.
You can only use this report to compare your own products to others and not analyze other products as you can with the Search Terms Report.
It is important to distinguish when a comparison has taken place between your product and another. Customers often browse and jump from one product to the next. You can use this to weed out products that do not represent a meaningful comparison. You should therefore check carefully whether the products being compared to yours are really suitable.
You can recognize unsuitable products by the corresponding percentage in the table. If these percentages are rather smooth, e.g. 25%, 50% or 100%, it is very likely that only few data are available and not many comparison behaviors have been included in the percentage. An actual comparison is then often not possible. You should therefore always question high percentages.
Key Metrics in Amazon Item Comparison Report
| Key figures | Explanation |
|---|---|
| ASIN | The ASIN is the Amazon Standard Identification Number. The unique identifier is assigned to all products offered on Amazon. |
| Product Title | The Product Title is the product name of your product. |
| Rank 1 of the compared ASINs | The customers who viewed your product also viewed this product. |
| 1st place of compared product titles | The product title of the product your customers viewed. |
| Rank 1 of compared in % | How often (in percent) this product was viewed by customers who also viewed your product on the same day. |
| … to 5th place | |
Understanding Amazon Alternate Purchase Behavior Report
In the Alternate Purchase Behaviour Report, you can view your products compared to other products. Your products are also displayed with 5 other products each. For these products, you can see how often the respective product was purchased instead of your own product within 24 hours. All products are displayed, regardless of the category or function of the other product.
Therefore, there may only be a maximum of 24 hours between the interaction “Viewing the product” and “Buying another product”, otherwise it is no longer an Alternate Purchase.
Key Metrics in Amazon Alternate Purchase Behavior Report
| Key figures | Explanation |
|---|---|
| ASIN | The ASIN is the Amazon Standard Identification Number. The unique identifier is assigned to all products offered on Amazon. |
| Product Title | The product title is the product name of your product. |
| No. 1 Purchased ASIN | The ASIN of the product most frequently purchased by customers who viewed your product but purchased another product. |
| #1 Purchased Product Title | The product title of the product your customer purchased. |
| No. 1 Purchased % | The percentage of orders that contain the alternative product in position 1 compared to the total number of orders of alternative products. |
| … to the 5th product purchased |
How to Use Amazon Item Comparison Reports for Competitive Advantage
With the report, you have the opportunity to gather knowledge about your competitors as well as customer buying behavior. For example, you can make your product more competitive and poach customers from your competitors by optimizing your PPC campaigns and your Listings.
The Item Comparison report also helps you apply product-specific targeting for PPC campaigns. By properly analyzing the report, you can target your competitors directly. It’s best to focus on products where the customer fluctuates between your product and a competitor’s product. Through specific targeting, you create an additional presence and ideally ensure that the customer ultimately decides in favor of your product. However, check individually beforehand whether your product is really suitable for this. After all, you don’t want the customer to decide in favor of your competitor’s product after all.
Likewise, you should take a closer look at the product listings of the competitor’s products if you notice that your product was looked at, but then another one was bought after all.
For example:
- What does the competitor’s product look like?
- What kind of images are used?
- What product features or benefits of the product are highlighted in the text?
With the information gathered, you can then compare your product’s listing. If you find that your product listing can be optimized in one place or another, you can incorporate your findings into the optimization process.
Another benefit you can gain is for your negative keywords in your PPC campaigns. You can quickly determine what context your product is showing up in by looking at the comparable products your product is being compared to. Then pay attention to what other products can/have and what your product may not be able to/have. Are your keywords perhaps suggesting something that your product can’t even serve? You should exclude such keywords from your campaign. This will help to prevent your product from being clicked on, but not bought.
Conclusion
The Amazon Item Comparison and Alternate Purchase Behavior reports provide crucial competitive intelligence for sellers and vendors. These reports offer deep insights into competitor products, customer behavior patterns, and optimization opportunities. By leveraging this data alongside other market analysis tools, you can enhance your competitive position and optimize both your PPC campaigns and product listings for maximum impact.
More articles, that may interest you:
- How to find Amazon Private Label suppliers and import goods
- Amazon Project Zero - Together Against Trademark Infringements
- Evaluate and Analyze Amazon Session and Conversion Data
- Amazon Product Opportunity Explorer: How to Identify Sales Opportunities
- Amazon Concessions Dashboard for Vendors: How to reduce concessions
Subscribe to Newsletter
Get the latest Amazon tips and updates delivered to your inbox.
We respect your privacy. Unsubscribe anytime.