Amazon Session & Conversion Data: Boost Your Sales Metrics
Trutz Fries
For Amazon Sellers there is only one solid currency on the marketplace and that is the turnover. Accordingly, many analyses focus on sales, price and turnover development.
But Amazon also offers sellers insights into the stages of the Amazon Sales Funnel, which take place before the actual transaction. However, this analysis option is not yet used by many sellers, which causes a lot of wasted money. Most sellers are already familiar with Amazon SEO, but a success control rarely takes place on the basis of numbers. Therefore, Amazon makes these figures available to the sellers.
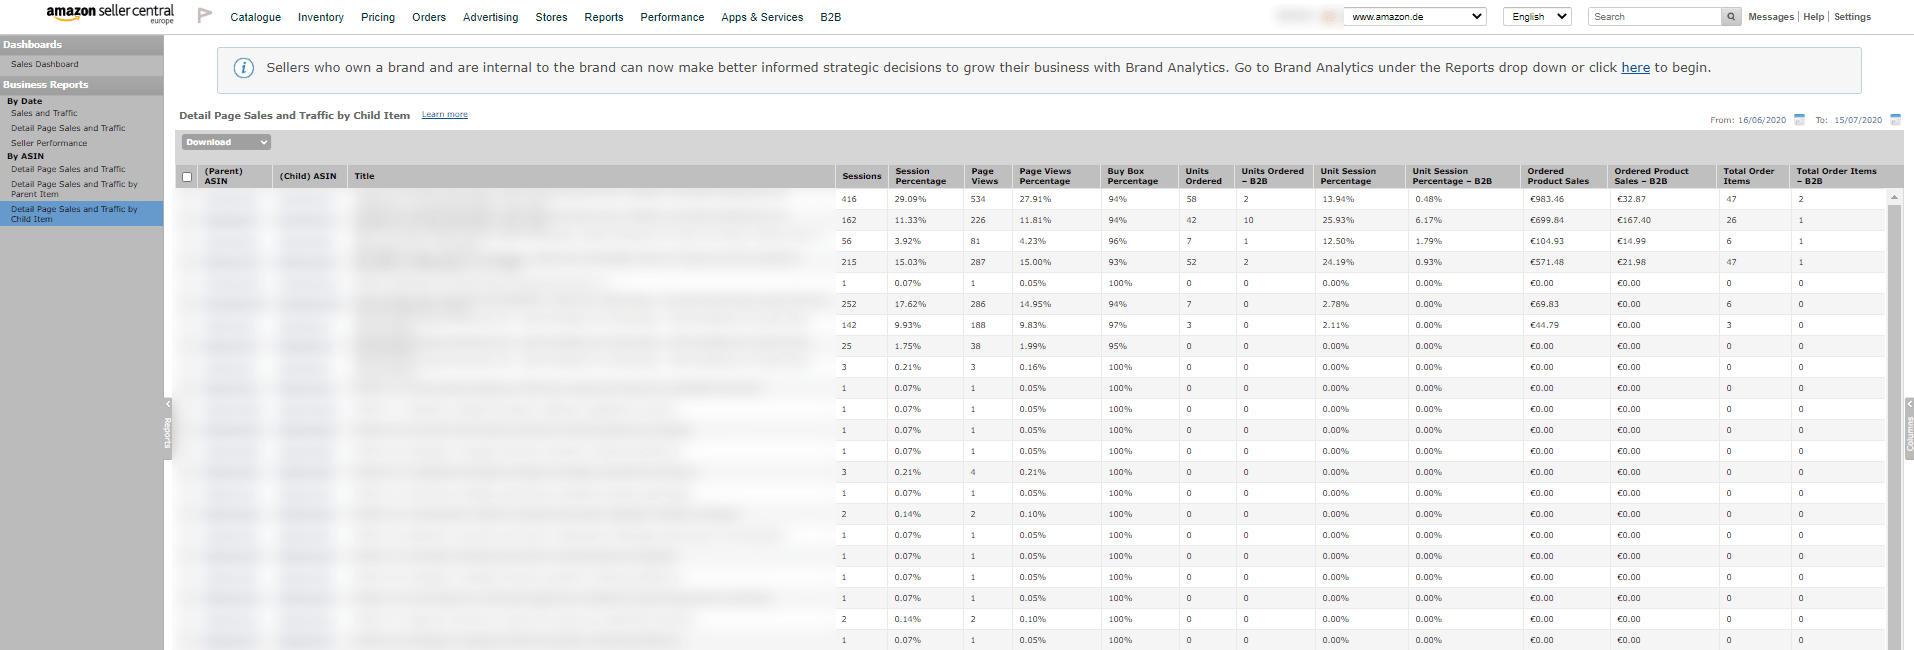
Amazon provides in the “Reports” section for each Child-ASIN among others the following values:
- Number of page views
- Number of unique visitors (sessions)
- Number of orders
- Number of units ordered
- Buybox share
The conversion rate can also be determined from the number of orders and the number of sessions.
The data can be obtained for different time periods. However, a download of the historical development is only possible if the data is backed up manually on a regular basis (AMALYTIX automates this process, more on this below).
You can use this data to check the success of listing optimizations. These measures can usually be sorted into two categories:
- Measures to increase the number of visitors
- Measures to improve the conversion rate
Increase the number of visitors
In order to get more visitors to one’s own Amazon listing, the seller must start at two different places:
- Increase the relevance of the product for as many matching search queries as possible
- Optimise the click-through rate (the proportion of visitors to impressions in the search results)
To better understand which search terms drive traffic to your listings, utilize the Amazon Search Query Performance Report for detailed keyword insights.
Increase relevance
In order for a potential customer to visit your listing, they must first be able to find it. Therefore, it is crucial to appear in the search-engine result pages (SERPS) for as many relevant searches of potential customers as possible. You should in fact be as far up as possible. Only about one third of all searchers navigate to the results on the second page (if you search via the desktop) or scroll far down.
We will not go into detail now about how a listing can be optimized using Amazon SEO. Just remember this: You have to understand what the customers are looking for and need to include the typical search terms in the title, in the Bullet Points (also called “highlights”), in the backend or in the description.
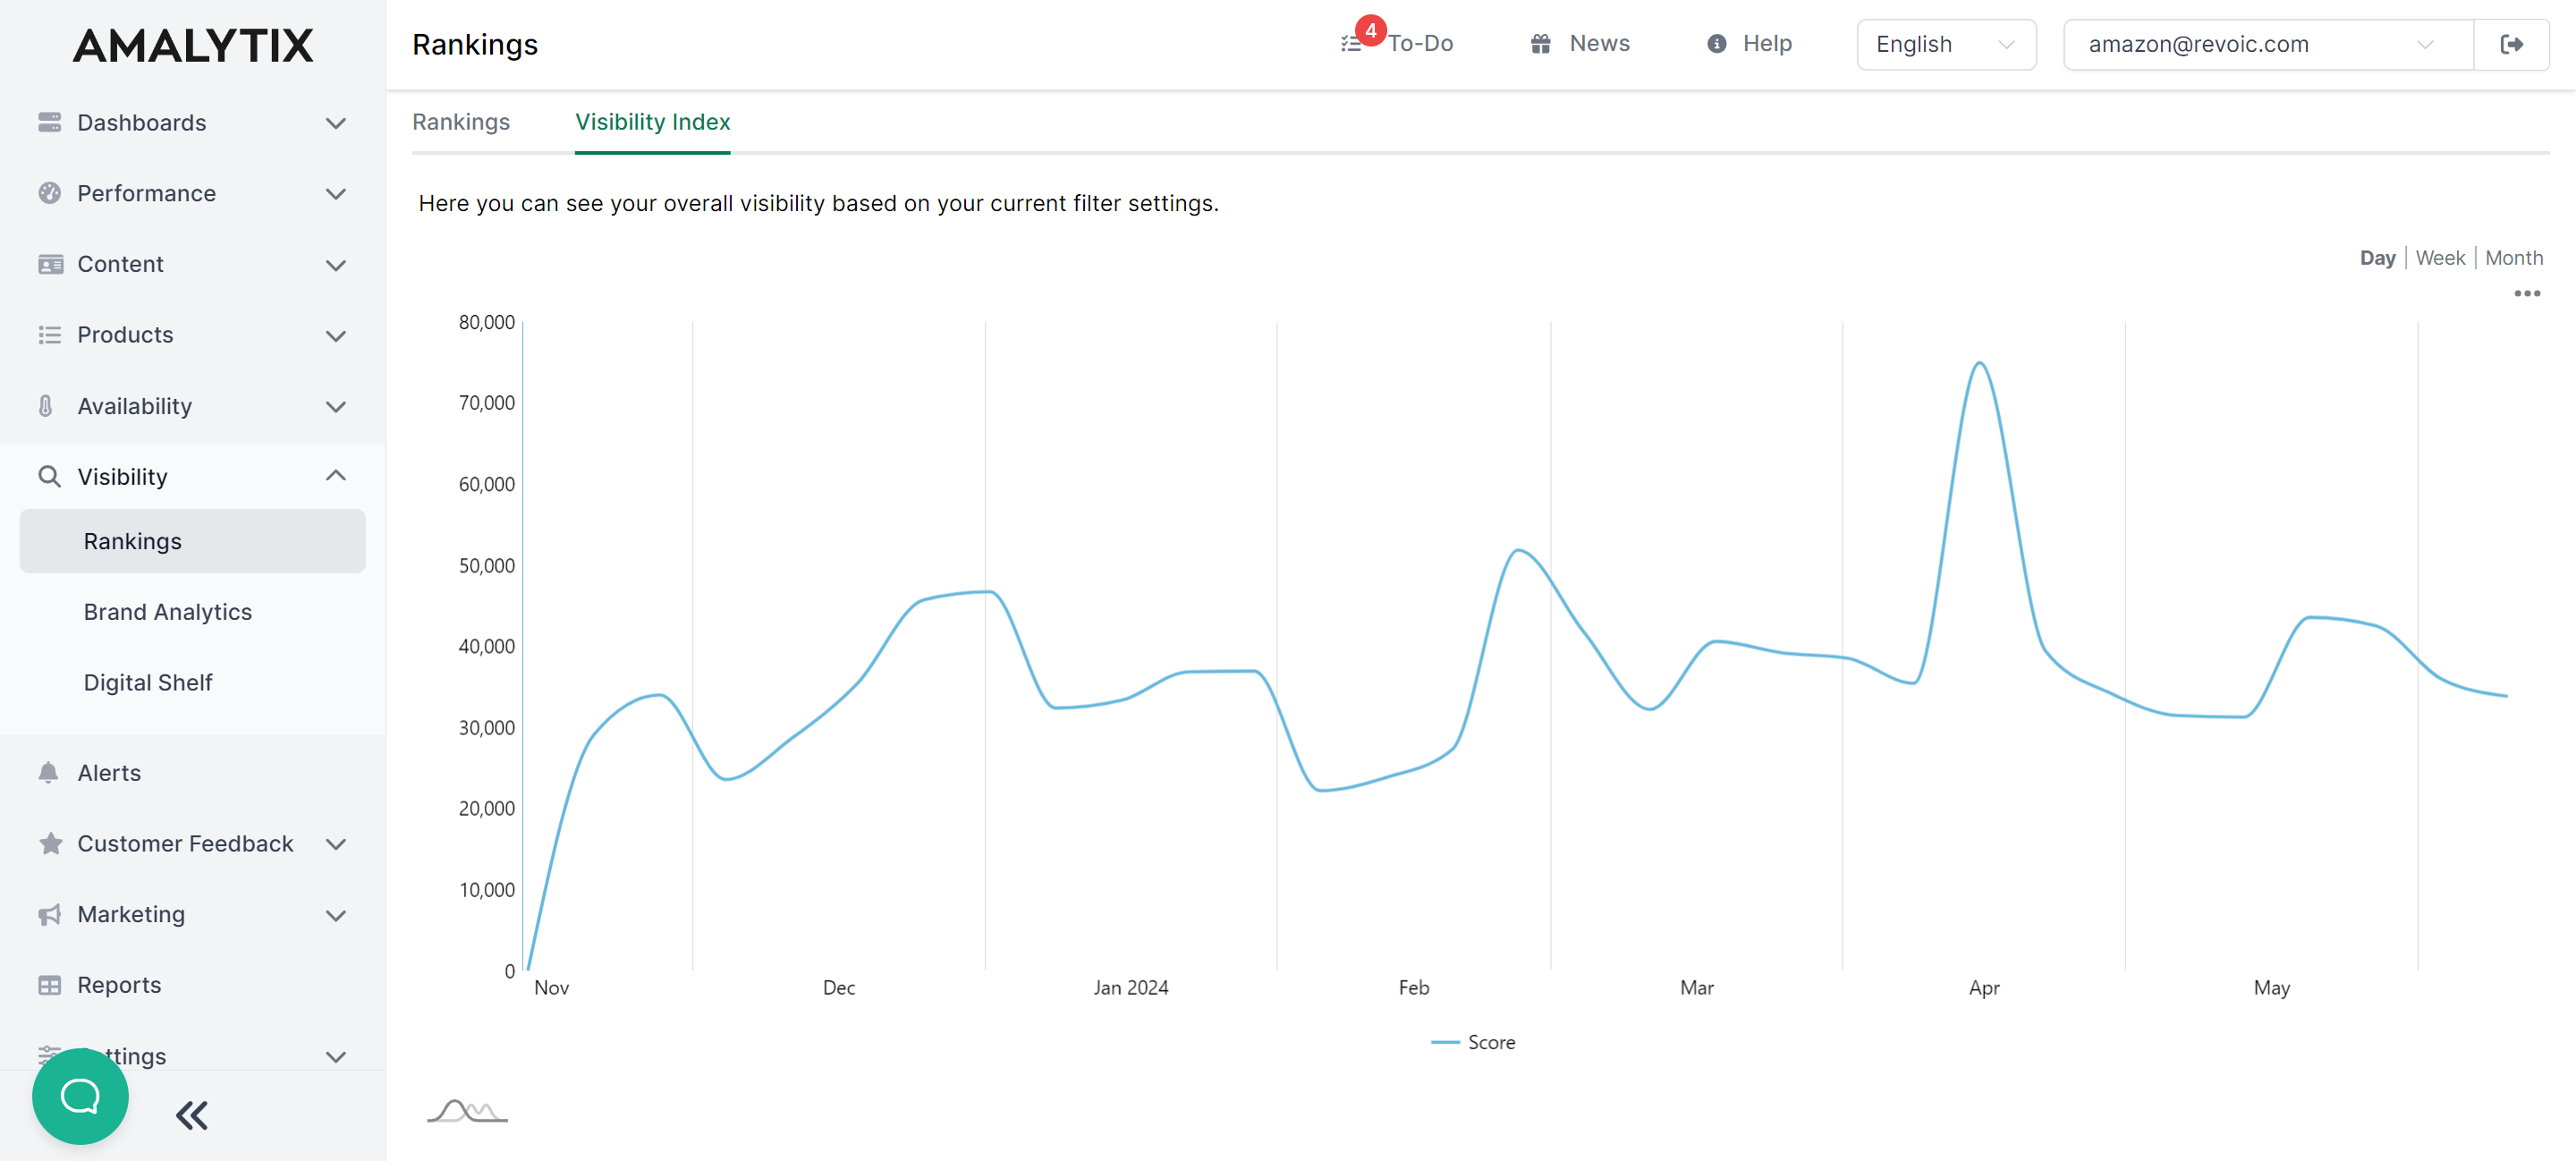
In order to monitor the success of these measures, you should store the relevant search terms in the analyse tool of your choice before the listing optimization and thus monitor the rankings of the respective product.
With AMALYTIX, this is done under the item Keywords / Rankings.
The emphasis is on before, otherwise it is difficult to check the success of the project afterwards. Success control includes two things:
- The respective product is considered “relevant” to Amazon. Tip: You can check whether Amazon considers a certain product to be relevant for a search term by searching for the (Child-)ASIN of the product as well as the search term, e.g. “B012345678 yoga matte”. If the respective product appears, Amazon considers it relevant.
- The product is at least in the top 20 (better yet, top 10).
Optimize CTR (Click-through rate)
To optimize the CTR of a product, you need to optimize the elements of the so-called “snippet”. The snippet is the sum of the product properties of a product that are displayed in the search results. These are usually the following elements:
- Product image (main image)
- Title
- Number and average value of all reviews
- Histogram of the reviews (popover)
- Availability
- prime logo if applicable
- expected delivery date
- Hint at “free delivery”.
- Discount campaigns
- Price
- Strike price
Only a few sellers consciously think about the design of the snippet. The number of elements that a seller can directly influence is greater than one might think. And especially when competing with other merchants, you should use every opportunity to gain an advantage.
Unfortunately, the CTR cannot be measured in the organic search results. The only way out is to analyse the data in the Amazon Sponsored Products campaigns. However, this is only possible if the product is the only product in an ad group. This would allow you to put the the number of clicks on the listing into the ratio of impressions. Furthermore, it is important that the CTR depends directly on the advertised search terms. The advertised keywords should cover the search behaviour of potential buyers as much as possible. In other words, if you sell apples and only bid on the term “pears” in the campaign, the CTR will be quite low and will say little about the snippet.
Targeting also has an influence on the CTR: Relevant comparisons can only be made via so-called “keyword targeting”. You should therefore limit benchmarking to pure keyword targeting campaigns or ad groups.
Optimize conversion rate
The conversion rate is essential for success. The following example shows that even a slight increase in the conversion rate leads to a disproportionate increase in orders.
- 1,000 visitors, conversion rate 10% = 100 orders
- 1.000 visitors, conversion rate 11% = 110 orders
An increase in the conversion rate of only 1% thus leads to an increase in sales of 10% (10 / 100). There are not many measures that have such a huge impact.
What is a good conversion rate?
If one analyses the conversion rates of the individual products, one sometimes gets very different results. Additionally, you “only” get the data for your own products, which makes benchmarking with other products in the same category very difficult. Therefore the question arises about when a conversion rate is “good”.
We have taken a look at the data of several products and in the following graphic you can see how different conversion rates are distributed over the number of products. This way you can judge for yourself whether your products perform below or above average in comparison to a sample of products.
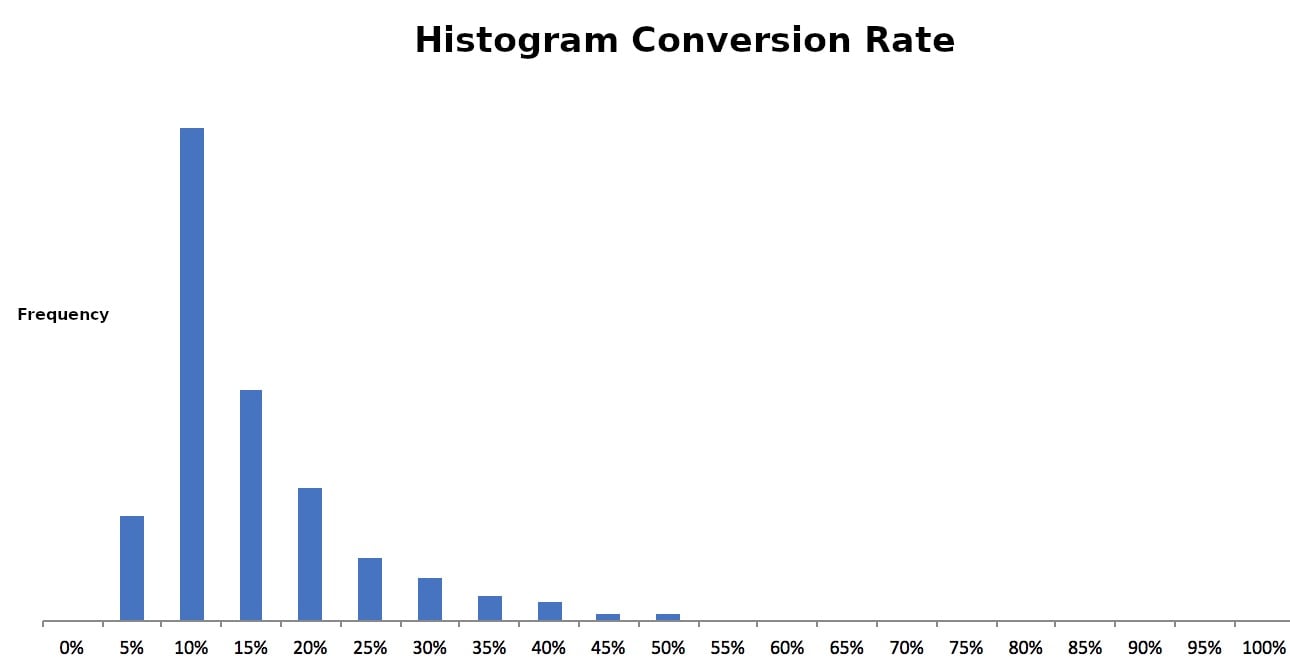
But even this graph does not offer any certainty in the end. After all, the conversion rate of a product is dependent on the category. Thus, products of daily use, for which the risk of making a bad buy and the complexity of the decision is low, are bought quicker (= higher conversion rate) than products that already have an investment character (TVs).
Another possibility is to carry out internal benchmarking. There are two available options:
- Analysis of the historical development of the conversion rate of the same product
- Comparison of the conversion rate with similar products of the own assortment
In the end, even the absolute highest number is not decisive. It is important to make an effort to improve and in the end to be able to see whether this improvement has occurred.
Run Amazon A/B tests
One method of finding out whether a change, for example to the listing, has been successful is to carry out so-called A/B tests. “A/B Testing” refers to the procedure in which two variants are compared against each other and, based on reliable figures, an attempt is made to identify the “better” variant in relation to the respective target.
A short example will illustrate this:
To find out which main image leads to more sales, run the same listing for four weeks once with main image 1 (variant A) and then again four weeks with main image 2 (variant B). At the end you compare the relevant metrics like number of visitors, conversion rate and sales. Note: All other parameters (texts, prices, discounts, average rating) leave them unchanged in the period to measure the influence of the image alone. It is also important that the availability of the product must be given in both periods and not switch between FBA or FBM. You should also ensure that special factors are excluded wherever possible (Prime Day or Christmas). During Prime Day or Christmas for example, consumer behaviour may be different due to discounts and does not necessarily allow a conclusion to be drawn about normal purchasing behaviour.
This rule applies of course only to products that are already well optimized and where fine-tuning is required. With comparatively badly optimized articles, you should of course immediately go to the maximum. To make an unoptimized product even worse is almost impossible.
To estimate whether the conversion rate between two periods has improved, you should choose sufficiently long periods to reduce the risk of statistical errors. These can never be completely ruled out, but the more clicks you have available for analysis, the lower the risk that a change in the conversion rate is simply random. By way of comparison, surveys conducted by renowned survey institutes generally always involve at least 1,000 people to ensure that the selected sample represents the population as well as possible.
Accordingly, you should - if possible - evaluate at least 1,000 clicks. However, only a few products have this high number of clicks in a manageable period of time. Often you will need to evaluate your decisions based on a few clicks, but you should be aware that smaller samples can lead to wrong decisions if the result was random.
One simple change that often leads to an improvement in conversion rates is to add Enhanced Brand Content (EBC) for sellers. This is mainly displayed on mobile devices and offers the opportunity to highlight product advantages and to stage your own brand once again. Good photos and texts as well as a feeling for a good design of the EBC templates are of course required.
Regular data extraction
Since it is quite time-consuming to extract the data from the Seller Central on a daily basis, we have developed a feature in AMALYTIX that downloads this data for you on a daily basis. Unfortunately this data is not available via the MWS (Marketplace Web Service) API, which makes it a bit more complex to download the data - but not impossible.
To do this, you must invite a special user with limited rights to your Seller Account. This user only needs access to the reports in the Seller Central.
Once created, AMALYTIX downloads the data daily and makes it accessible, in the “KPI” tab on the product detail page of a product.
This feature is included in the “Large Plan” and is currently only available to Marketplace Sellers.
More articles, that may interest you:
- How to find Amazon Private Label suppliers and import goods
- Amazon Project Zero - Together Against Trademark Infringements
- Amazon Product Opportunity Explorer: How to Identify Sales Opportunities
- Amazon Concessions Dashboard for Vendors: How to reduce concessions
- The “Item Comparison and Alternate Purchase Behavior Report” Explained in Detail
Subscribe to Newsletter
Get the latest Amazon tips and updates delivered to your inbox.
We respect your privacy. Unsubscribe anytime.