Amazon BI
With Amazon BI (Business Intelligence), you can create professional dashboards directly within AMALYTIX. Analyze your Amazon data visually, identify trends, and make informed decisions — all without any technical expertise.
What is Amazon BI?
Amazon BI extends the existing Custom Dashboards with significantly more capabilities:
| Feature | Custom Dashboards | Amazon BI |
|---|---|---|
| Visualizations | 7 widget types | 17+ chart types (maps, pivot tables, funnels, etc.) |
| Data sources | Predefined KPIs | Access to all AMALYTIX data fields |
| Time ranges | Up to 28 days | Unlimited historical analysis |
| Custom data | Not available | Integration of your own data sources |
| Export | Excel/CSV | PDF, email reports, scheduled exports |
| Query Builder | Not available | Visual editor for complex queries |
Who is Amazon BI for?
- Amazon Vendors and Sellers who need deeper insights into their data and want to understand correlations between different KPIs.
- Agencies that want to offer their clients tailored reporting and professional reports.
- Teams that want to collaborate on dashboards and share insights.
Where can I find Amazon BI?
Navigate to Dashboards > Amazon BI in the sidebar. After clicking, the Amazon BI interface opens directly within AMALYTIX.
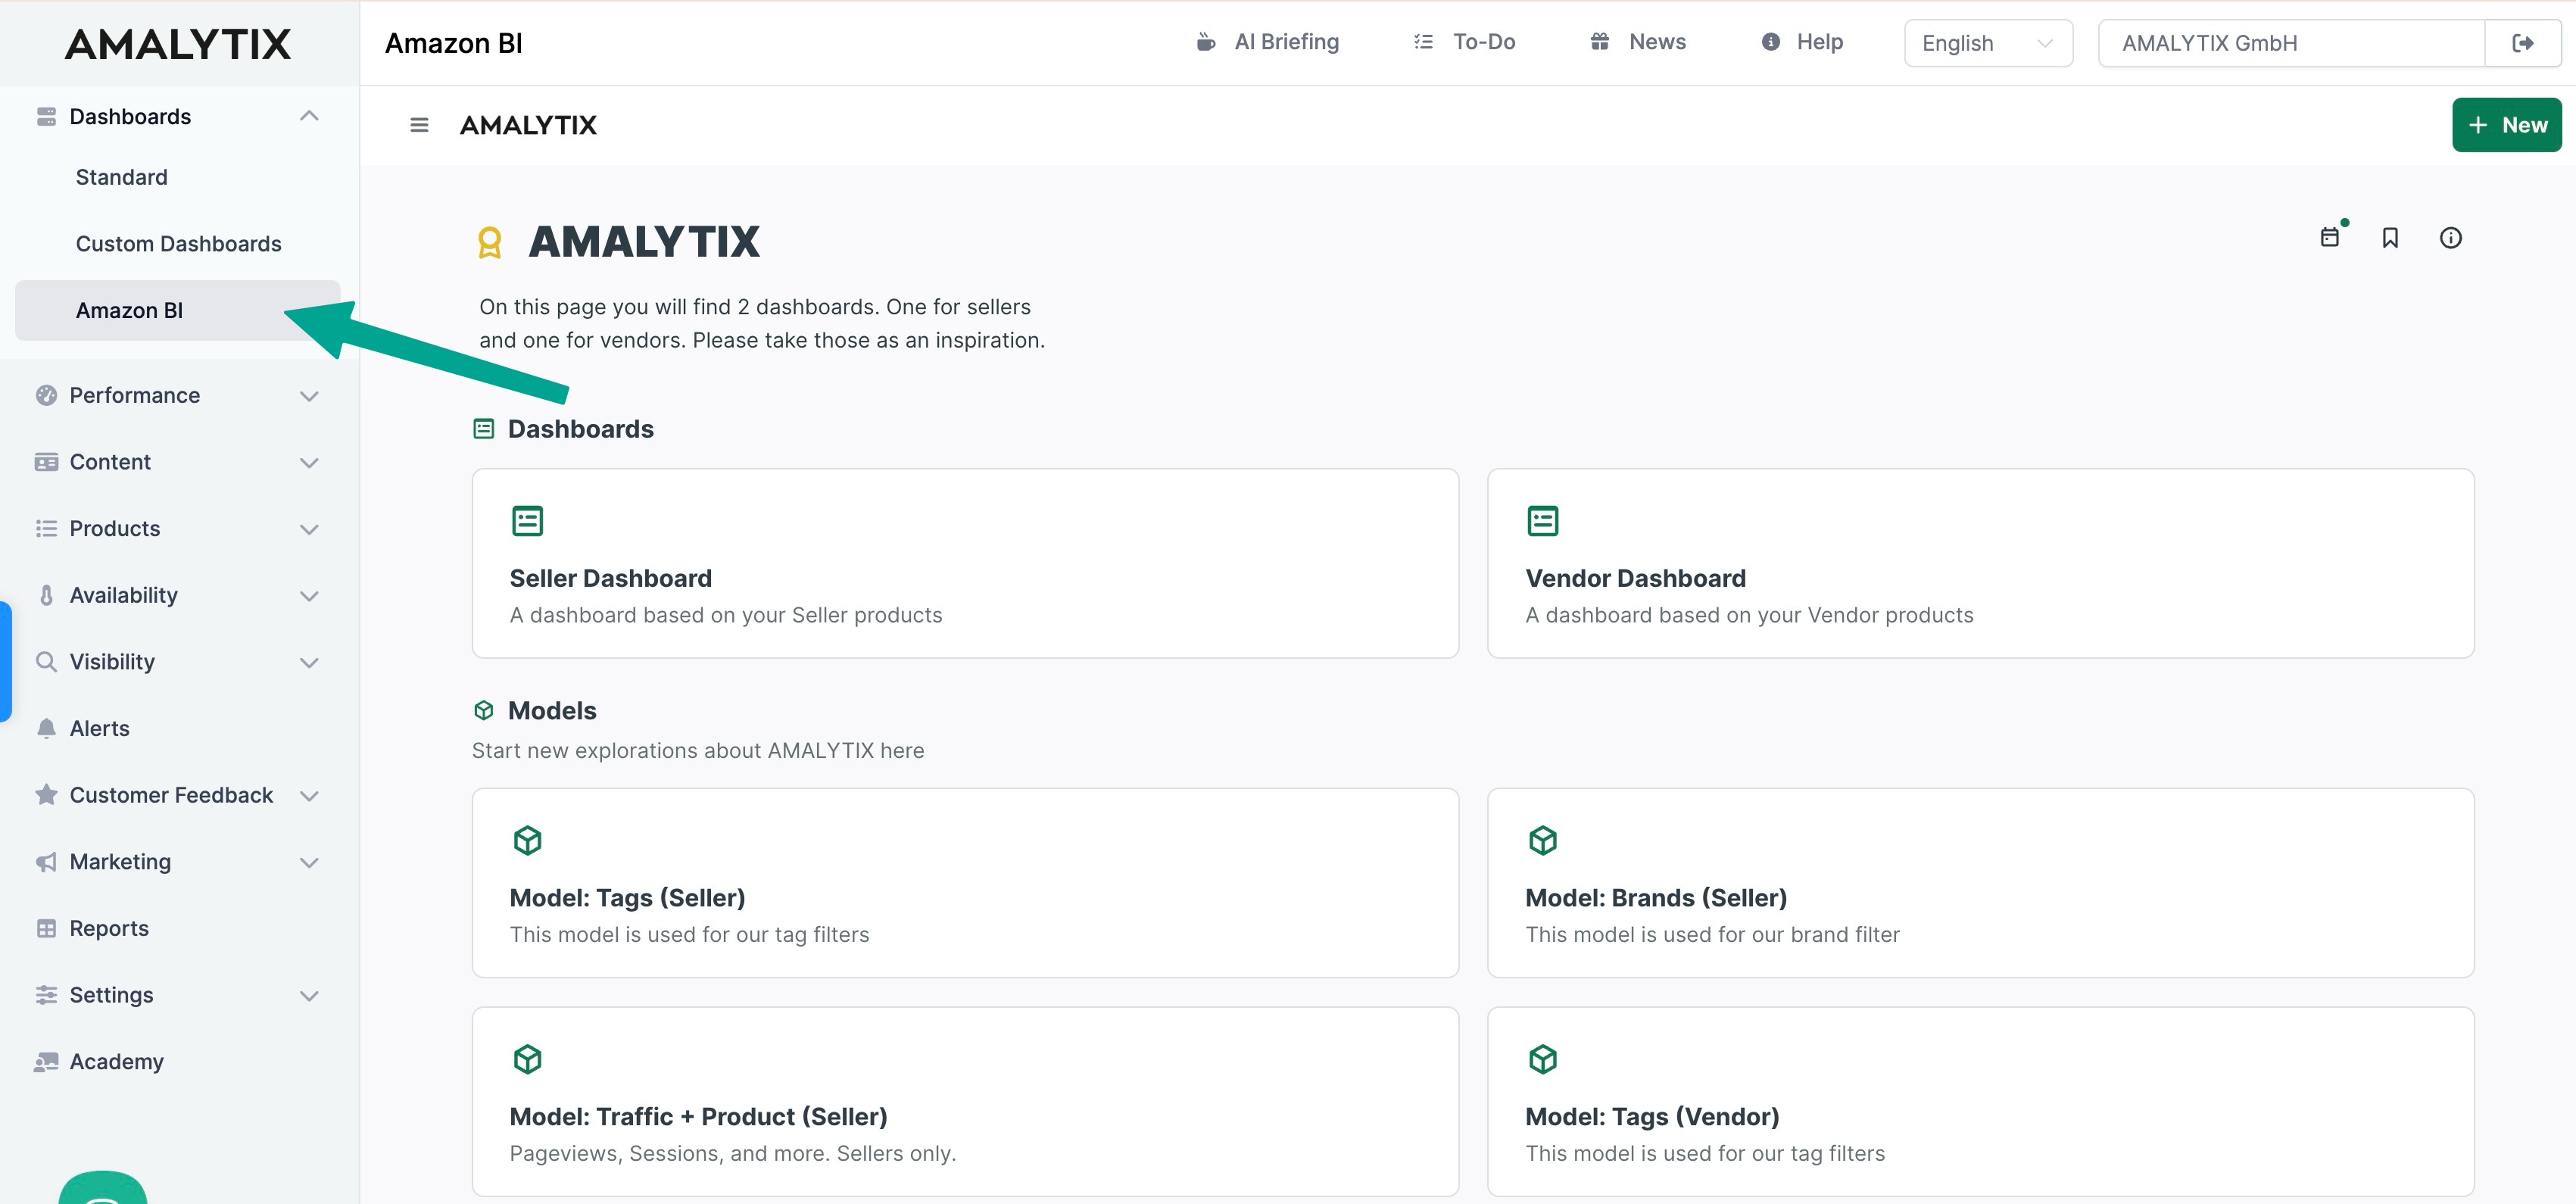
Pre-built Dashboards
When you get started, you will find two ready-to-use example dashboards:
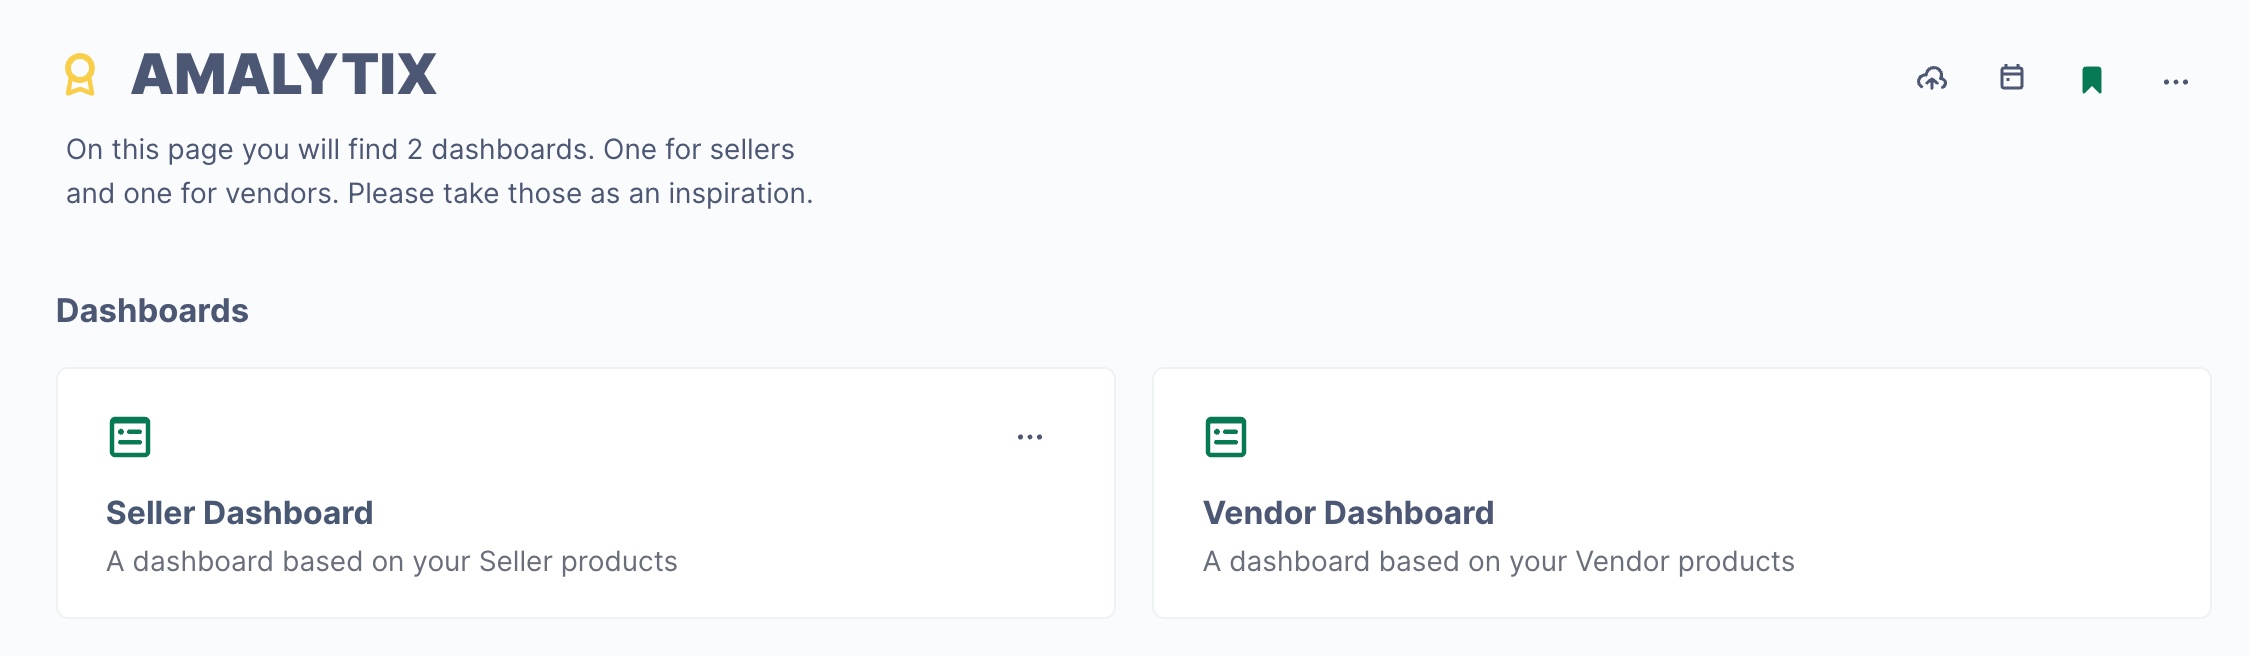
| Dashboard | Description |
|---|---|
| Seller Dashboard | Optimized for Seller accounts with all relevant Seller metrics |
| Vendor Dashboard | Optimized for Vendor accounts with Vendor Central data |
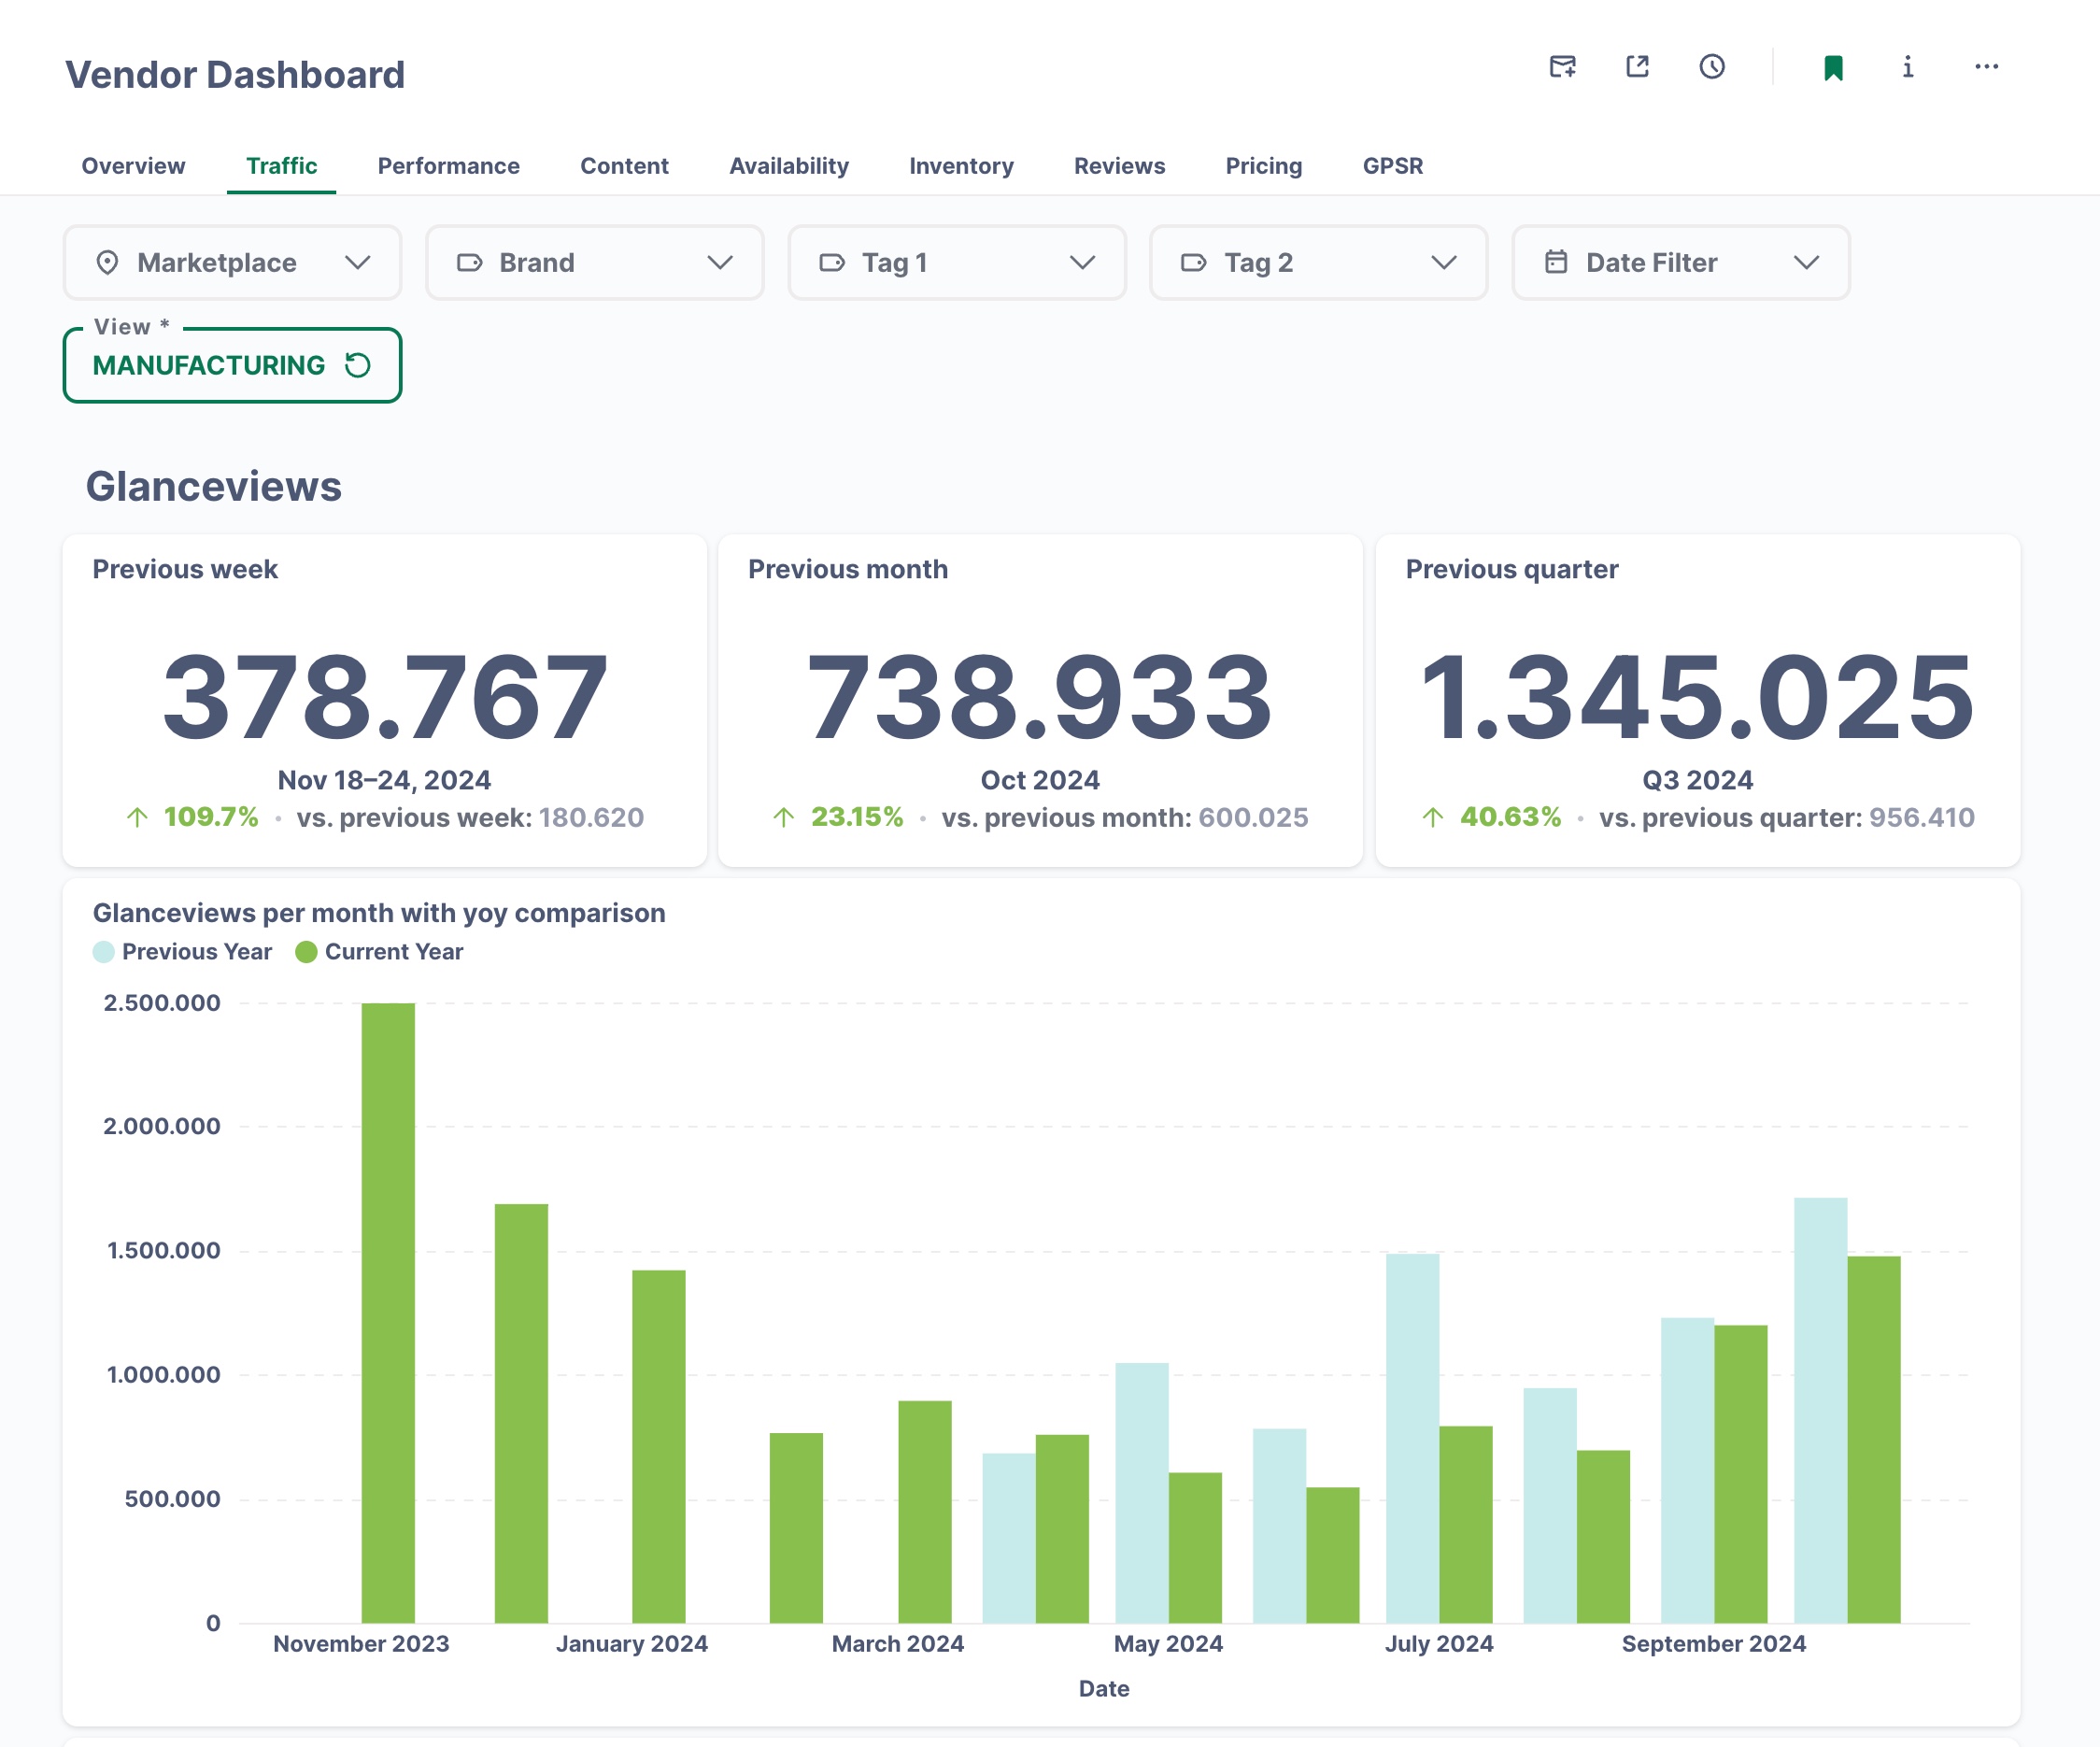
Both dashboards are organized into thematic tabs:
| Tab | Contents |
|---|---|
| Overview | Products by marketplace, brand, category, and product type |
| Traffic | Page views (glance views) with year-over-year comparison |
| Performance | Revenue and sales analysis across different dimensions |
| Content | Listing Quality Index distribution, A+ Content status |
| Availability | Products without Buybox, availability over time |
| Inventory | Stock level information and coverage |
| Reviews | Distribution and development of your product reviews |
| Pricing | Average price trends |
| GPSR | Products with GPSR issues (General Product Safety Regulation) |
Tip: Use the pre-built dashboards as inspiration. You can duplicate them and customize them to fit your needs.
Creating Your Own Dashboards
The visual Query Builder makes creating your own dashboards easy:
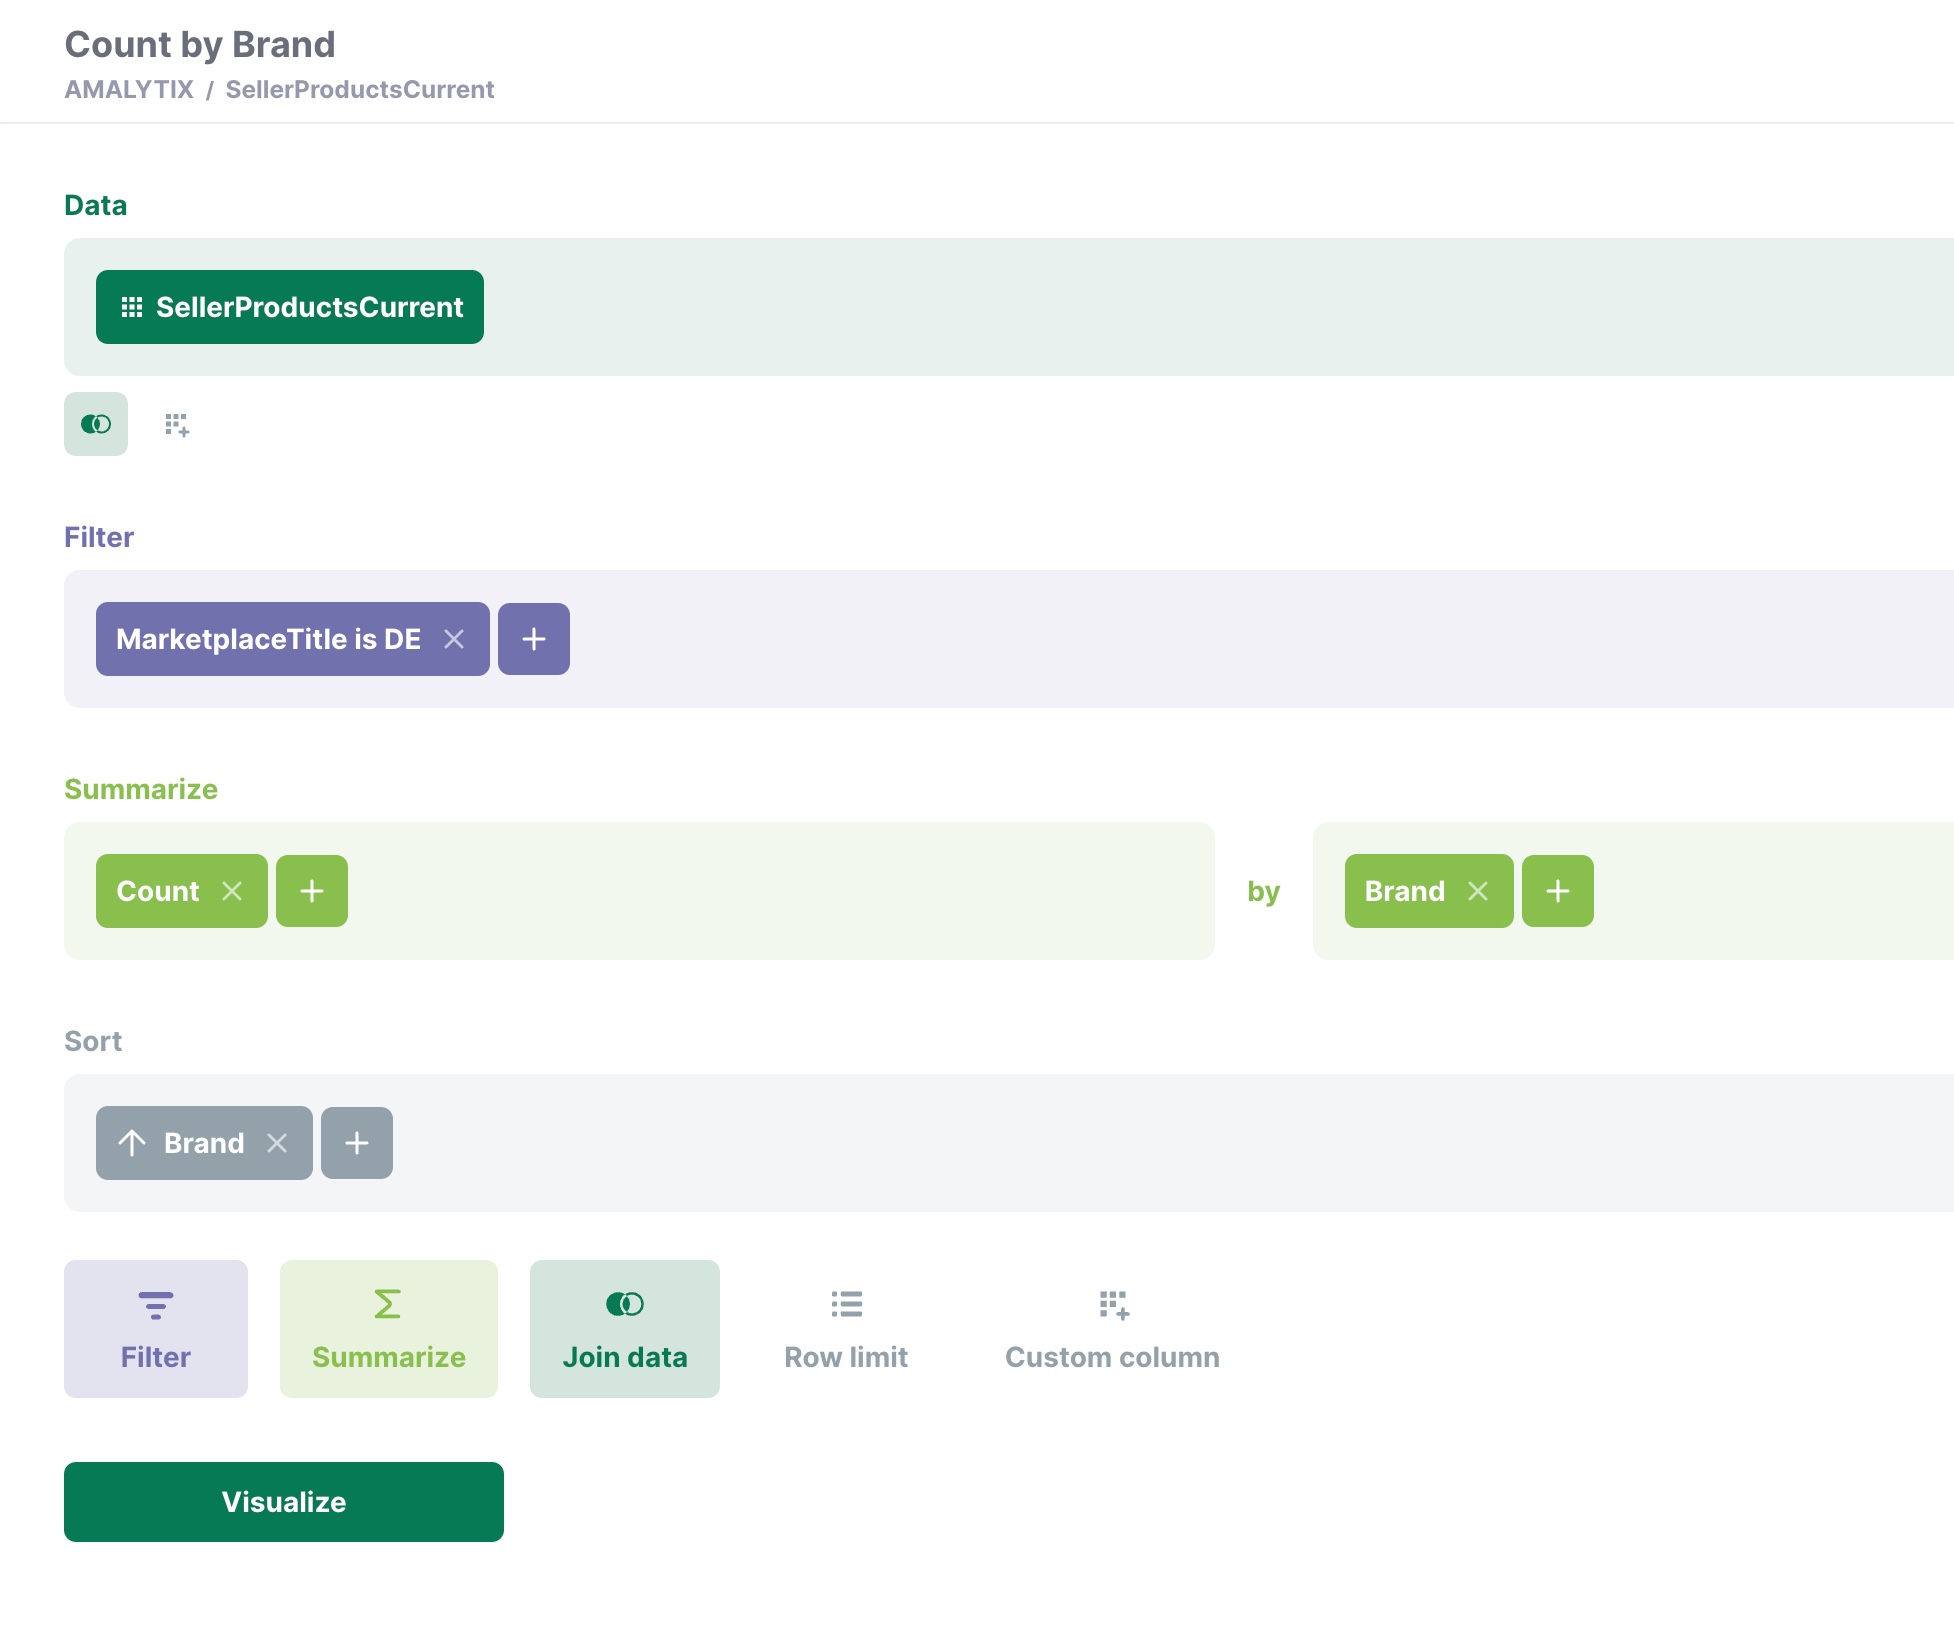
How to create a new dashboard
- Click the + icon or select New > Dashboard
- Add charts by clicking + within the dashboard
- Choose a data source (e.g., “SellerProductsCurrent” or “VendorProductsCurrent”)
- Configure filters, groupings, and aggregations
- Select the desired visualization
- Save the dashboard
Available Query Builder functions
| Function | Description |
|---|---|
| Data | Select the data source (Seller or Vendor data) |
| Filter | Narrow down to specific marketplaces, brands, categories, etc. |
| Summarize | Aggregate data (count, sum, average, min, max) |
| Join data | Combine multiple data sources |
| Row limit | Limit the number of displayed records |
| Custom column | Create calculated fields |
Visualizations
Amazon BI offers 17+ visualization types for every use case:
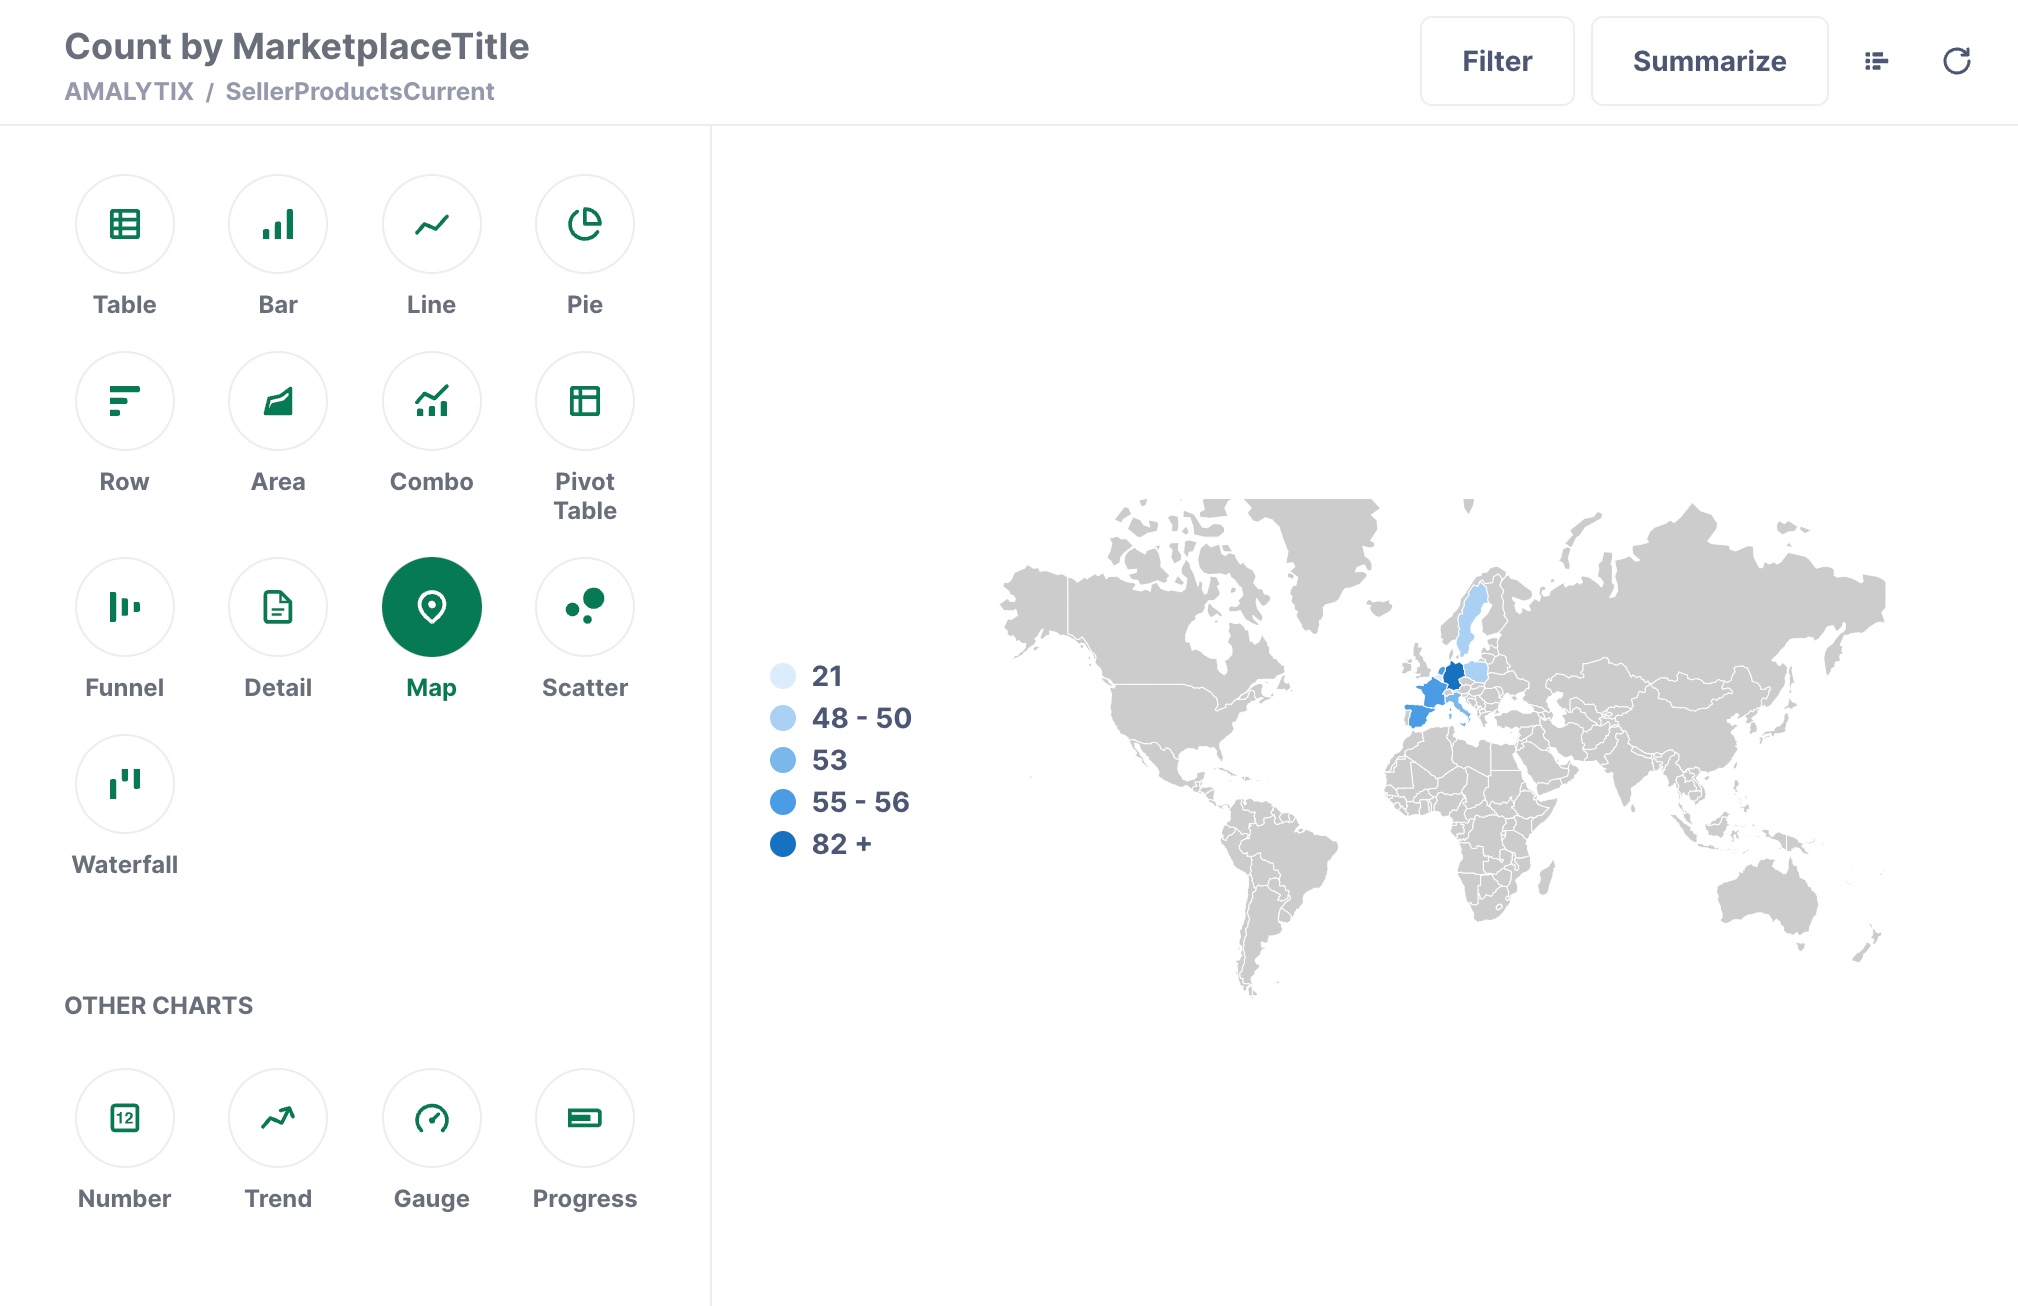
Standard Charts
| Type | Use case |
|---|---|
| Table | Detailed data tables with sorting and filtering |
| Bar | Comparing categories (e.g., revenue by brand) |
| Line | Time series and trend analysis |
| Pie | Percentage distributions |
| Area | Stacked time series |
| Combo | Combined bar and line charts |
Advanced Charts
| Type | Use case |
|---|---|
| Pivot Table | Cross-tabulations for multidimensional analysis |
| Map | Geographic visualization by country |
| Funnel | Conversion funnels |
| Scatter | Correlation analysis between two metrics |
| Waterfall | Visualizing changes |
KPI Widgets
| Type | Use case |
|---|---|
| Number | Single KPI with optional comparison value |
| Trend | Small trend line for a quick overview |
| Gauge | Gauge visualization for goal achievement |
| Progress | Progress bar |
Filters and Interactivity
Dashboards can be made interactive:
- Dashboard filters: Dropdown menus for marketplace, brand, time period, etc. apply to all charts
- Drill-down: Click on data points to see details
- Linked filters: One chart can filter other charts
- Date filters: Flexible time ranges with year-over-year comparison
Export and Reports
| Function | Description |
|---|---|
| PDF export | Download dashboard as PDF |
| Email reports | Automatic scheduled delivery via email |
| Data export | Export individual charts as CSV or Excel |
| Share | Share dashboard link with team members |
Getting Started
- Start with the example dashboards — Explore the pre-built dashboards to learn what is possible
- Copy and customize — Duplicate an existing dashboard and tailor it to your needs
- Create your own charts — Experiment with the Query Builder
- Add filters — Make your dashboards interactive
For detailed instructions, see our Amazon BI FAQs.
Related Topics
- Amazon BI FAQs - Frequently asked questions and video tutorials
- Standard Dashboard - The pre-configured AMALYTIX dashboard
- Custom Dashboards - The simpler alternative for basic dashboards