Custom Dashboards
Custom dashboards let you create personalized views with the metrics that matter most to your business. Unlike the Standard Dashboard, you have full control over which KPIs are displayed.
Why Custom Dashboards?
- Focused overview: Display only the metrics relevant to your daily work
- Faster decisions: All important KPIs at a glance without navigating through different pages
- Team alignment: Create dashboards for different departments or responsibilities
- Trend detection: Track developments over time with line charts
Creating a Dashboard
- Navigate to Dashboards > Custom Dashboards in the sidebar
- Click Create New Dashboard in the upper right corner
- Enter a title and press Enter to confirm
You can now either:
- Select a template - Pre-configured dashboards for common use cases
- Add widgets individually - Build your dashboard from scratch
Dashboard Templates
AMALYTIX offers three pre-built templates to help you get started:
| Template | Widgets | Focus |
|---|---|---|
| Content Template | 13 | Listing quality, A+ content, images, videos, keywords |
| Reviews Template | 8 | Ratings, reviews, average ratings by brand/marketplace |
| Buybox Template | 3 | Buybox status, availability |
After selecting a template, you can customize all widgets to your needs, remove them, or add more.
Widget Types
Custom dashboards support seven widget types:
| Type | Description | Typical Use |
|---|---|---|
| Number | Single metric with comparison to previous period | Revenue, product count |
| Top List | Highest values (limit: 10, 25, or 50) | Bestsellers, most reviews |
| Lowest List | Lowest values (limit: 10, 25, or 50) | Worst performers, lowest LQI |
| Line Chart | Time-series visualization (day/month) | Revenue trend, rating trend |
| Pie Chart | Category distribution | Revenue by marketplace |
| Histogram | Bar charts grouped by dimension | Ratings by brand |
| Divider | Visual section separator | Dashboard organization |
Adding Widgets
Click Add Widget to open the widget configuration:
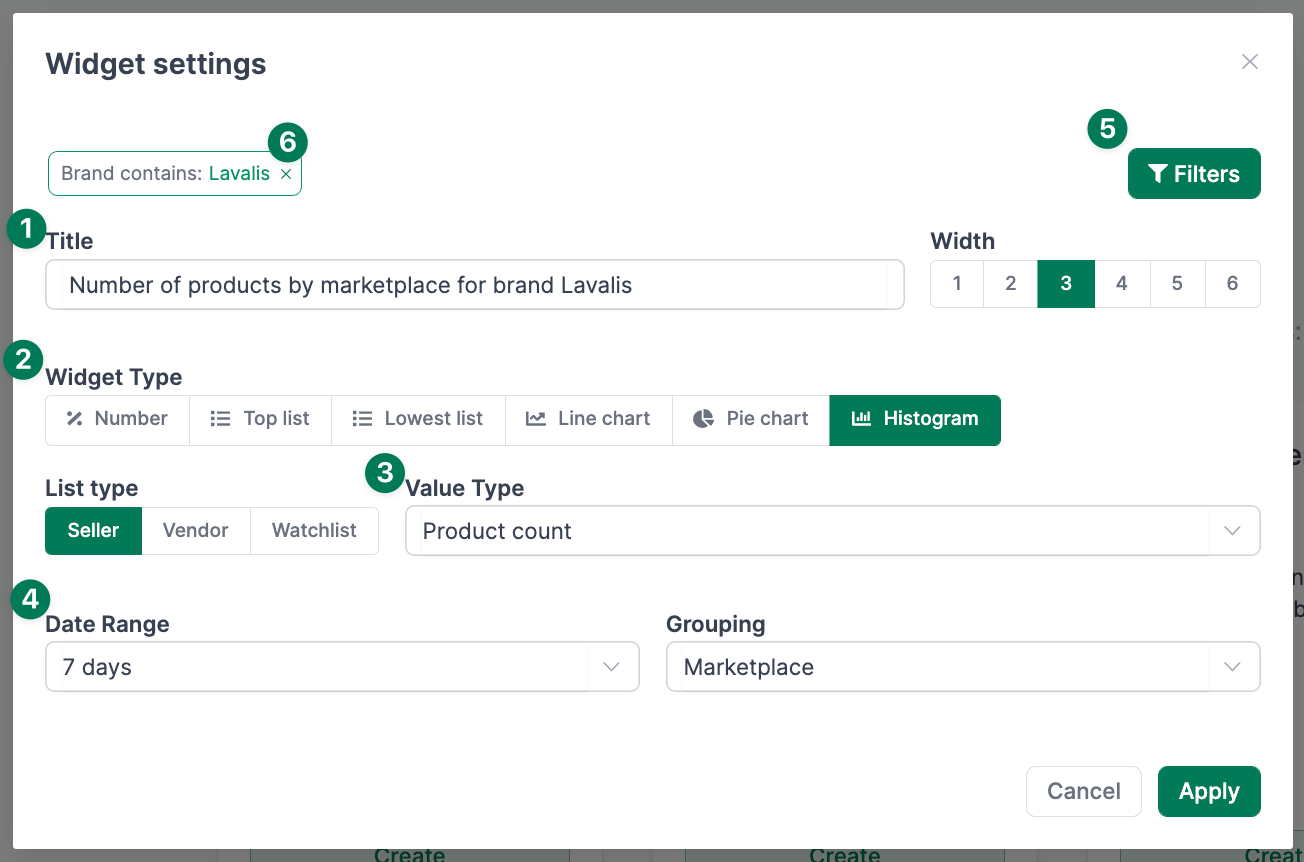
Widget Settings
- Title - Give your widget a meaningful name
- Width - Choose from 1 to 6 columns (6 takes full width)
- Widget Type - Select the visualization style
- List Type - Seller, Vendor, or Watchlist
- Value Type - Choose the KPI to display
Available value types are grouped by category:
- Revenue / Sales: Revenue, Sales (Seller); Shipped COGS, Shipped Revenues, Ordered Units (Vendor)
- Buybox: Buybox percentage, Page views, Sessions, Conversion rate
- Catalog: Product count, LQI (Listing Quality Index)
- Ratings / Reviews: Number of ratings, Average rating, Top reviews rating
- Inventory: Stock levels, Aged inventory (Vendor only)
- Date Range - 7 days, 14 days, 28 days, or last month
- Grouping (for charts) - Day, Month, Marketplace, Brand, or Category
- Limit (for lists) - 10, 25, or 50 entries
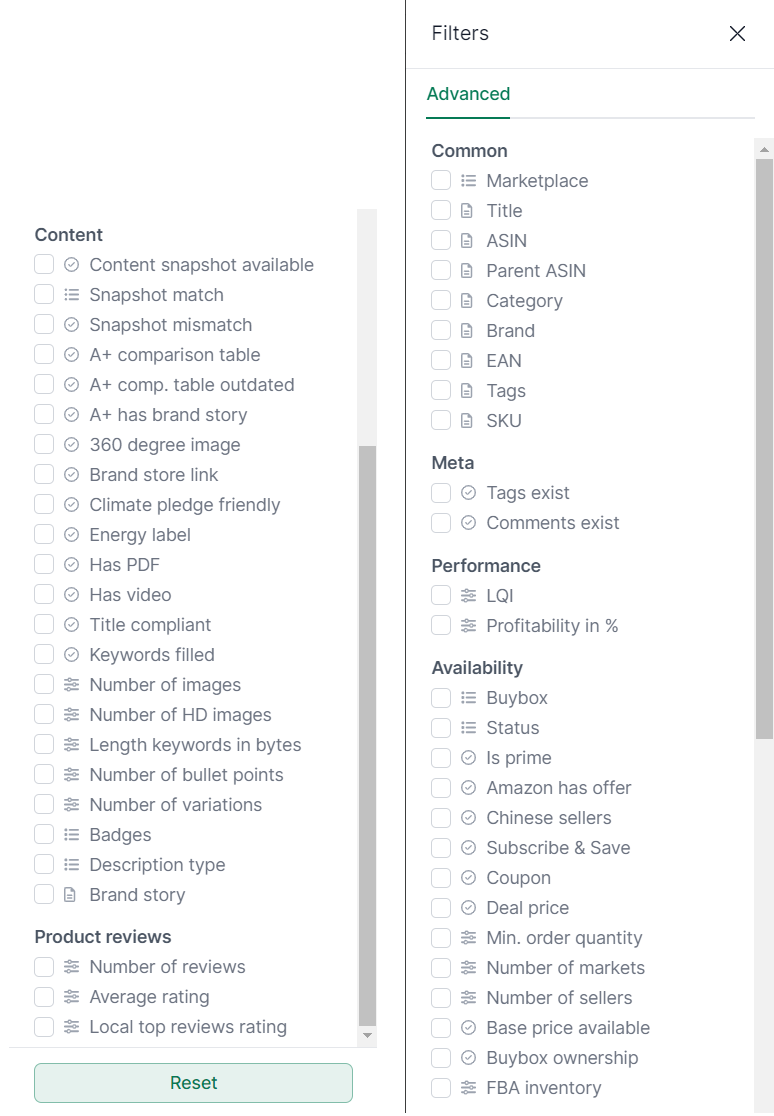
Adding Filters
Use the Filter button to narrow down widgets to specific products. The extensive filter options include:
- General: Marketplace, Brand, Category, ASIN, Tags, SKU
- Performance: LQI, Revenue, Advertising costs
- Availability: Buybox status, Prime, Inventory
- Content: A+ content, Videos, Images, Bullet points, Title compliance
- Reviews: Number of reviews, Average rating
Active filters are displayed above the widget title.
Managing Widgets
Click the three-dot menu on any widget for these actions:
- Edit - Modify widget settings
- Clone - Duplicate the widget (useful for similar views with different filters)
- Download - Export data as Excel or CSV
- Delete - Remove the widget
Use drag and drop to rearrange widgets.
Dashboard Actions
From the dashboard view, the following actions are available:
- Export as PDF - Download the entire dashboard as a PDF (ideal for reporting)
- Clone - Duplicate the dashboard
- Mark as Favorite - For quick access in the dashboard list
- Delete - Remove the dashboard
Best Practices
- Thematic dashboards: Create separate dashboards for different purposes (e.g., “Daily Revenue Check”, “Content Quality”, etc.)
- Start with templates: Use templates as a starting point and customize them to your needs
- Use dividers: Add divider widgets to visually organize related metrics
- Regular exports: Export data regularly for reporting and analysis
- Optimize width: Use different widget widths for a clear layout
Related Topics
- Standard Dashboard - The pre-configured AMALYTIX dashboard
- Products - Detailed product view
- Content View - Listing quality in detail