Standard Dashboard
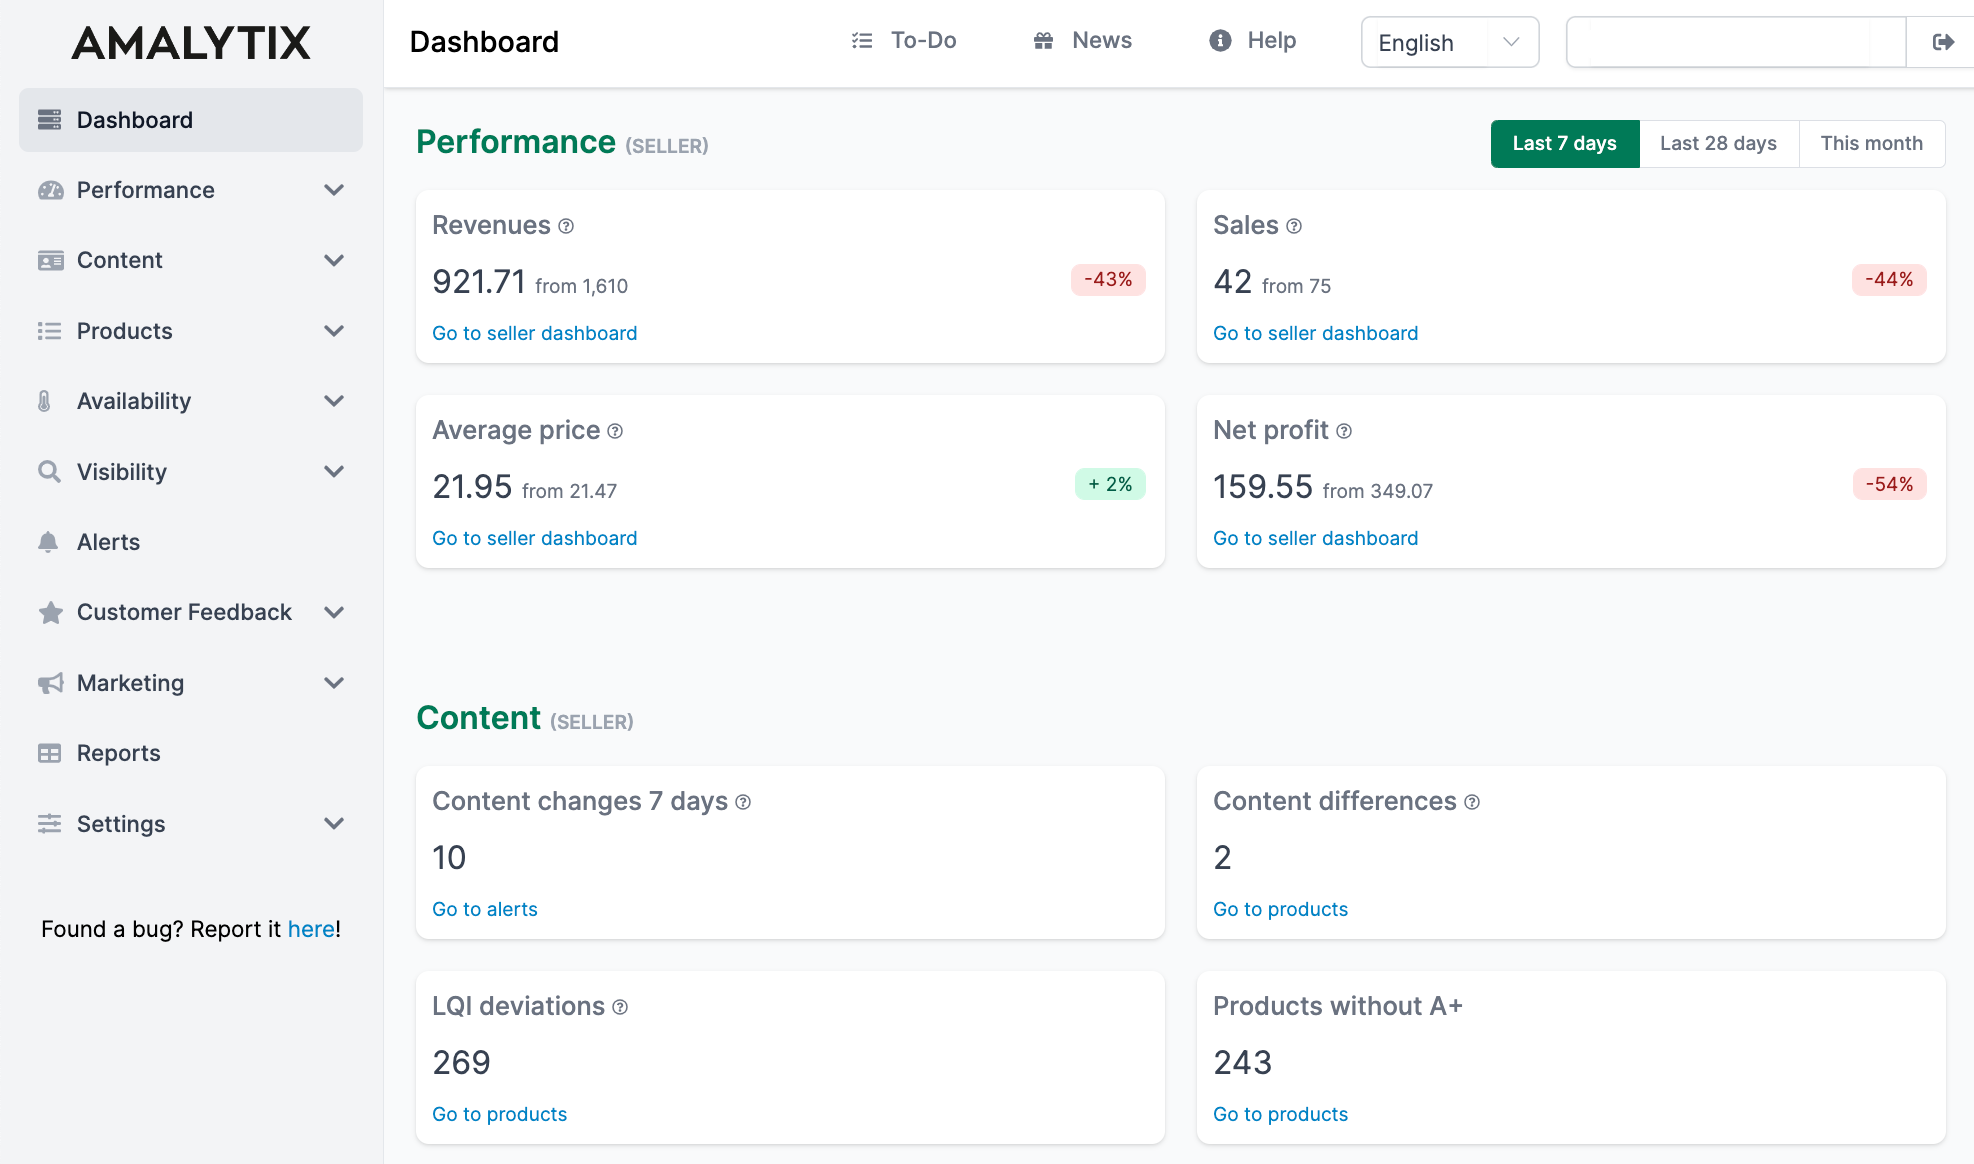
The Standard Dashboard is your central hub for all key Amazon metrics. At a glance, you can see how your Seller and/or Vendor account is performing - without navigating through multiple sections.
Key feature: Every metric is clickable and takes you directly to the detailed view in AMALYTIX.
Dashboard Structure
The dashboard is organized into five sections:
| Section | What You See | Why It Matters |
|---|---|---|
| Performance | Revenue, sales, prices | Shows your business success |
| Content | Listing quality and changes | Helps optimize your product pages |
| Availability | Stock levels and buybox status | Prevents lost sales |
| Customer Satisfaction | Feedback overview | Shows how customers rate you |
| Advertising | Ad performance | Optimizes your ad spend |
Seller and Vendor Data
Depending on your account type, you see different data:
- Seller account: All five sections with seller-specific metrics
- Vendor account: Adjusted metrics based on vendor data
- Both accounts: Separate rows for Seller and Vendor in each section
Comparing Time Periods
Many tiles let you choose the time period. You will see:
- The current value for the selected period
- The previous period value for comparison
- The percentage change (green = improvement, red = decline)
Performance
This section shows your sales figures. Choose between last 7 days, last 28 days, or current month.
| Metric | Description | Data Source |
|---|---|---|
| Revenue | Total value of all orders | Order data (Seller) / Sourcing View (Vendor) |
| Sales | Number of units sold | Order data (Seller) / Sourcing View (Vendor) |
| Average Price | Average selling price per unit | Calculated from revenue / sales |
| Net Profit | Profit after cost of goods | Financial transactions (Seller only) |
Click any tile to go to the Seller Dashboard or Vendor Dashboard.
Content
Here you see the status of your product listings - no time filter needed since it reflects the current state.
| Metric | Description | What to Do |
|---|---|---|
| Content Changes (7d) | Listing changes in the last 7 days | Check for unexpected changes |
| Snapshot Deviations | Differences from your saved snapshot | Restore listings to desired state |
| LQI Deviations | Products with Listing Quality Index below 100 | Optimize content |
| Products without A+ Content | Listings missing enhanced content | Create A+ Content |
Content changes include: product titles, bullet points, A+ Content, main image, additional images, and book descriptions.
Learn more: Product List and Snapshots
Availability
This section helps you prevent lost sales.
| Metric | Description | Impact |
|---|---|---|
| Not Available | Products that cannot be purchased | No revenue possible |
| Lost Buybox | Products where you do not hold the buybox | Significantly fewer sales |
| Low Inventory | Less than 30 days of stock (Seller only) | Will sell out soon |
| High Inventory | More than 90 days of stock (Seller only) | Capital tied up, storage fees |
| Out of Stock | FBA products with zero inventory (Seller only) | No sales, ranking loss |
For Vendor accounts, inventory monitoring is limited since Amazon manages the stock.
Learn more: FBA Dashboard
Customer Satisfaction
Keep track of your seller feedback. Choose between last 7 days or yesterday.
| Metric | Description |
|---|---|
| New Seller Feedback | Shows three values: Total | Positive | Negative |
The display shows at a glance how many new reviews you received and the ratio of positive to negative feedback.
Learn more: Monitor Seller Feedback
Advertising
Overview of your Amazon PPC campaigns. Choose between last 7 days or last 28 days.
| Metric | Description | Goal |
|---|---|---|
| Revenue | Sales generated from advertising | As high as possible |
| Orders | Number of orders from ads | As high as possible |
| Costs | Total ad spend | Within budget |
| ACoS | Advertising Cost of Sale (costs / revenue) | As low as possible |
Tip: A rising ACoS with flat revenue indicates inefficient campaigns.
Learn more: Monitor Amazon Advertising