Brand Metrics
Brand Metrics shows you how customers interact with your brand on Amazon - from the first search impression to purchase. This helps you understand where customers drop off and where you have optimization potential.
The Four Core Metrics
Brand Metrics measures the customer journey in four consecutive steps:
Brand Searches
Customers who searched for your brand but never clicked on a product detail page or made a purchase.
What does this mean? This metric shows your brand awareness. High values mean customers are actively searching for your brand. If many search but don’t click, review your product images and titles in search results.
Consideration
Customers who viewed the product detail page or added the product to their cart but did not complete the purchase.
What does this mean? These customers show genuine purchase interest. If many are interested but don’t buy, examine your product detail page: Are the price, description, and reviews convincing?
Purchases
Customers who actually bought your product.
What does this mean? The most important metric - this is where revenue is generated. Compare with the previous stages to identify conversion issues.
Conversion Rate
The percentage of customers who moved from consideration to purchase.
What does this mean? The higher the rate, the more effectively your product pages convert. Low rates indicate optimization potential in content, pricing, or reviews.
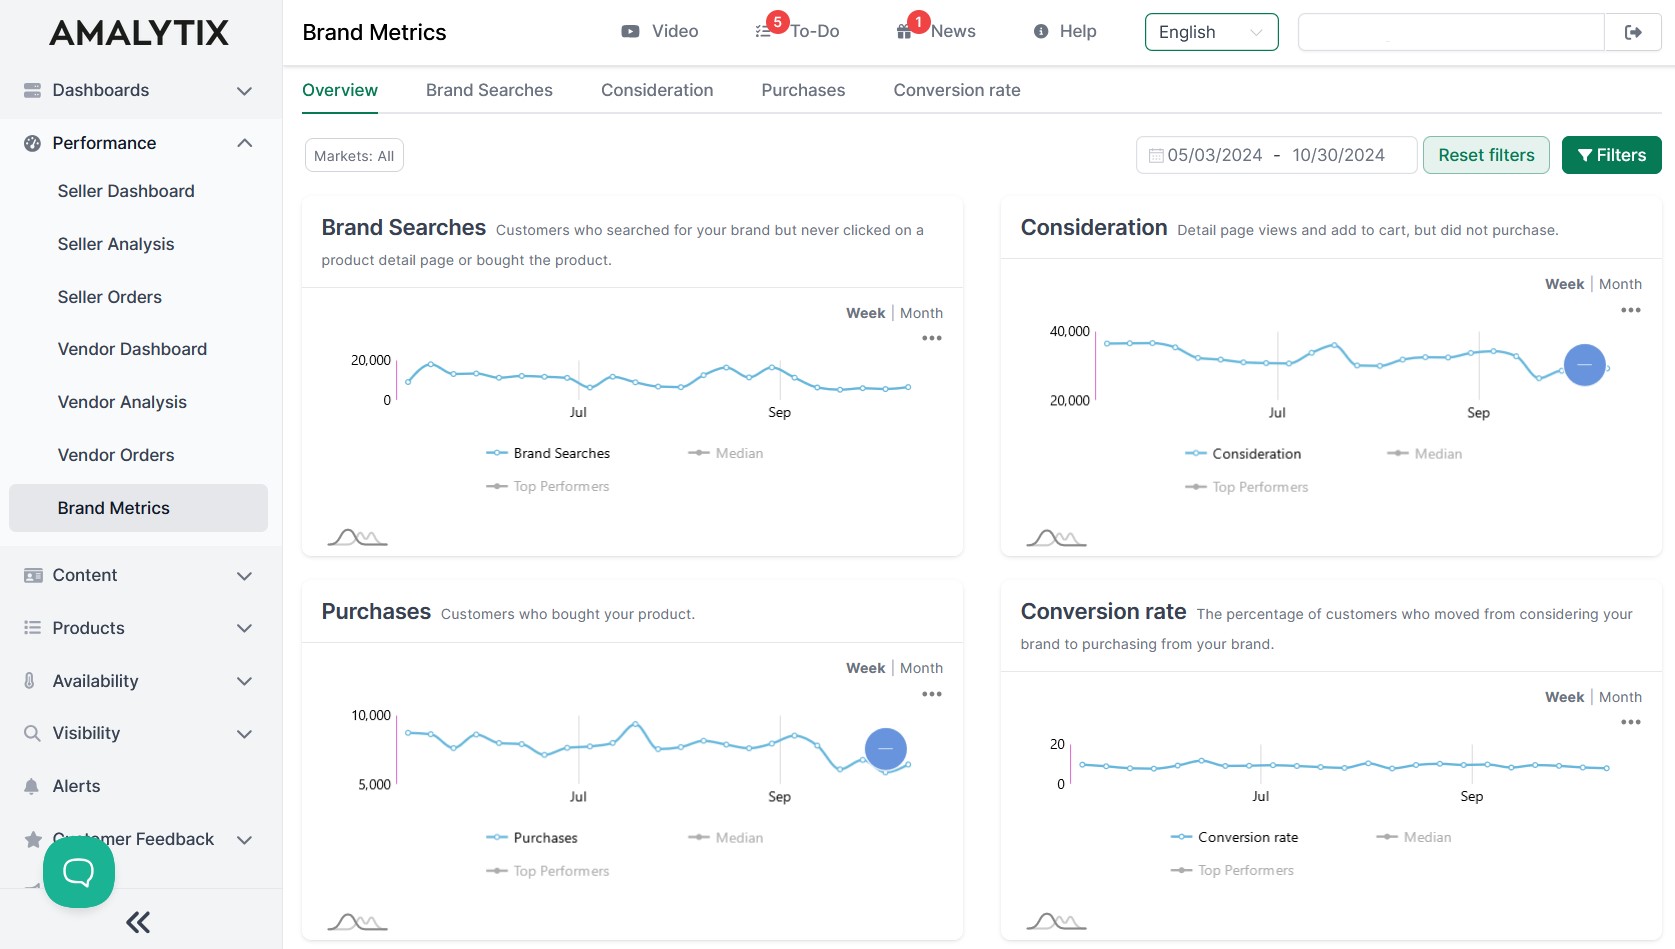
Overview Tab
The Overview page shows all four metrics at a glance. Each chart can be toggled between weekly and monthly views. This allows you to quickly identify trends and seasonal patterns.
Detailed View per Metric
Each metric has its own tab with extended analysis:
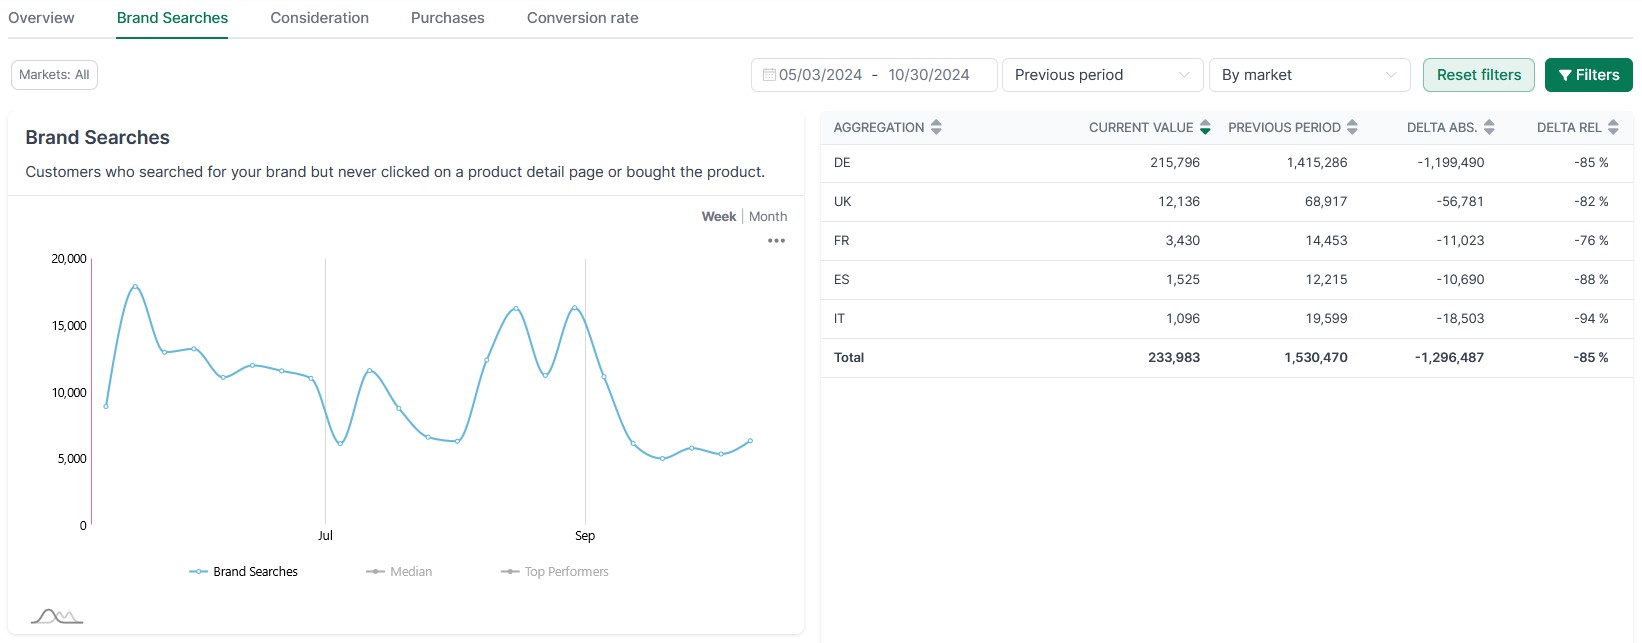
Chart with Comparison Values
In the chart, you can compare your values with benchmarks:
- Median: The average of all brands in your category
- Top Performers: The most successful brands in your category
This shows you where you stand compared to the competition.
Comparison Table
The table shows your current values compared to the previous period or previous year:
| Column | Description |
|---|---|
| Aggregation | Grouping (by marketplace, brand, or category) |
| Current Value | Value in the selected time period |
| Previous Period | Value in the comparison period |
| Delta abs. | Absolute change |
| Delta rel. | Percentage change |
Aggregation Options
Group your data by:
- By Marketplace: Compare across Amazon countries (DE, UK, FR, etc.)
- By Brand: Compare your different brands
- By Category: Compare across product categories
Comparison Period
Choose the comparison period:
- Previous Period: Compare with the immediately preceding time period
- Last Year: Compare with the same period in the previous year
Filter Options
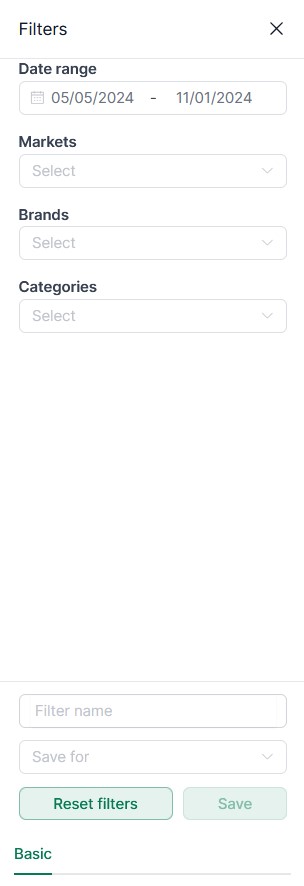
Customize the analysis to your needs:
- Date Range: Select the analysis period
- Markets: Filter by specific Amazon marketplaces
- Brands: Analyze individual or multiple brands
- Categories: Focus on specific product categories
Save Filters
You can save frequently used filter settings and quickly recall them later. Saved filters can be kept private or shared with your team.
Benefits
- Understand the customer journey: See where customers drop off in the purchase process
- Benchmarking: Compare yourself with competitors in your category
- Identify trends: Monitor developments over weeks and months
- Targeted optimization: Identify whether you should work on brand awareness, product pages, or pricing
- Measure success: Track how your optimizations affect the metrics
Data Source
Brand Metrics are based on Amazon’s own Brand Analytics data. This data is only available to brand owners with a registered trademark on Amazon.