Seller Payments
The following video gives you a good overview:
What Are Seller Payments?
In the “Seller Payments” section, you analyze and optimize the performance of your Amazon business. Compare payments over time to identify trends as well as winners and losers in your product portfolio.
With this module you can answer questions like:
- Which product families had the highest sales increases or decreases this month compared to the previous month?
- Which brands generated a higher or lower contribution margin this month compared to the same month last year?
- In which categories do we currently generate the highest or lowest revenue?
- Which marketplaces have gained or lost the most in relative terms this month?
The Seller Payments section is divided into four tabs:
Overview
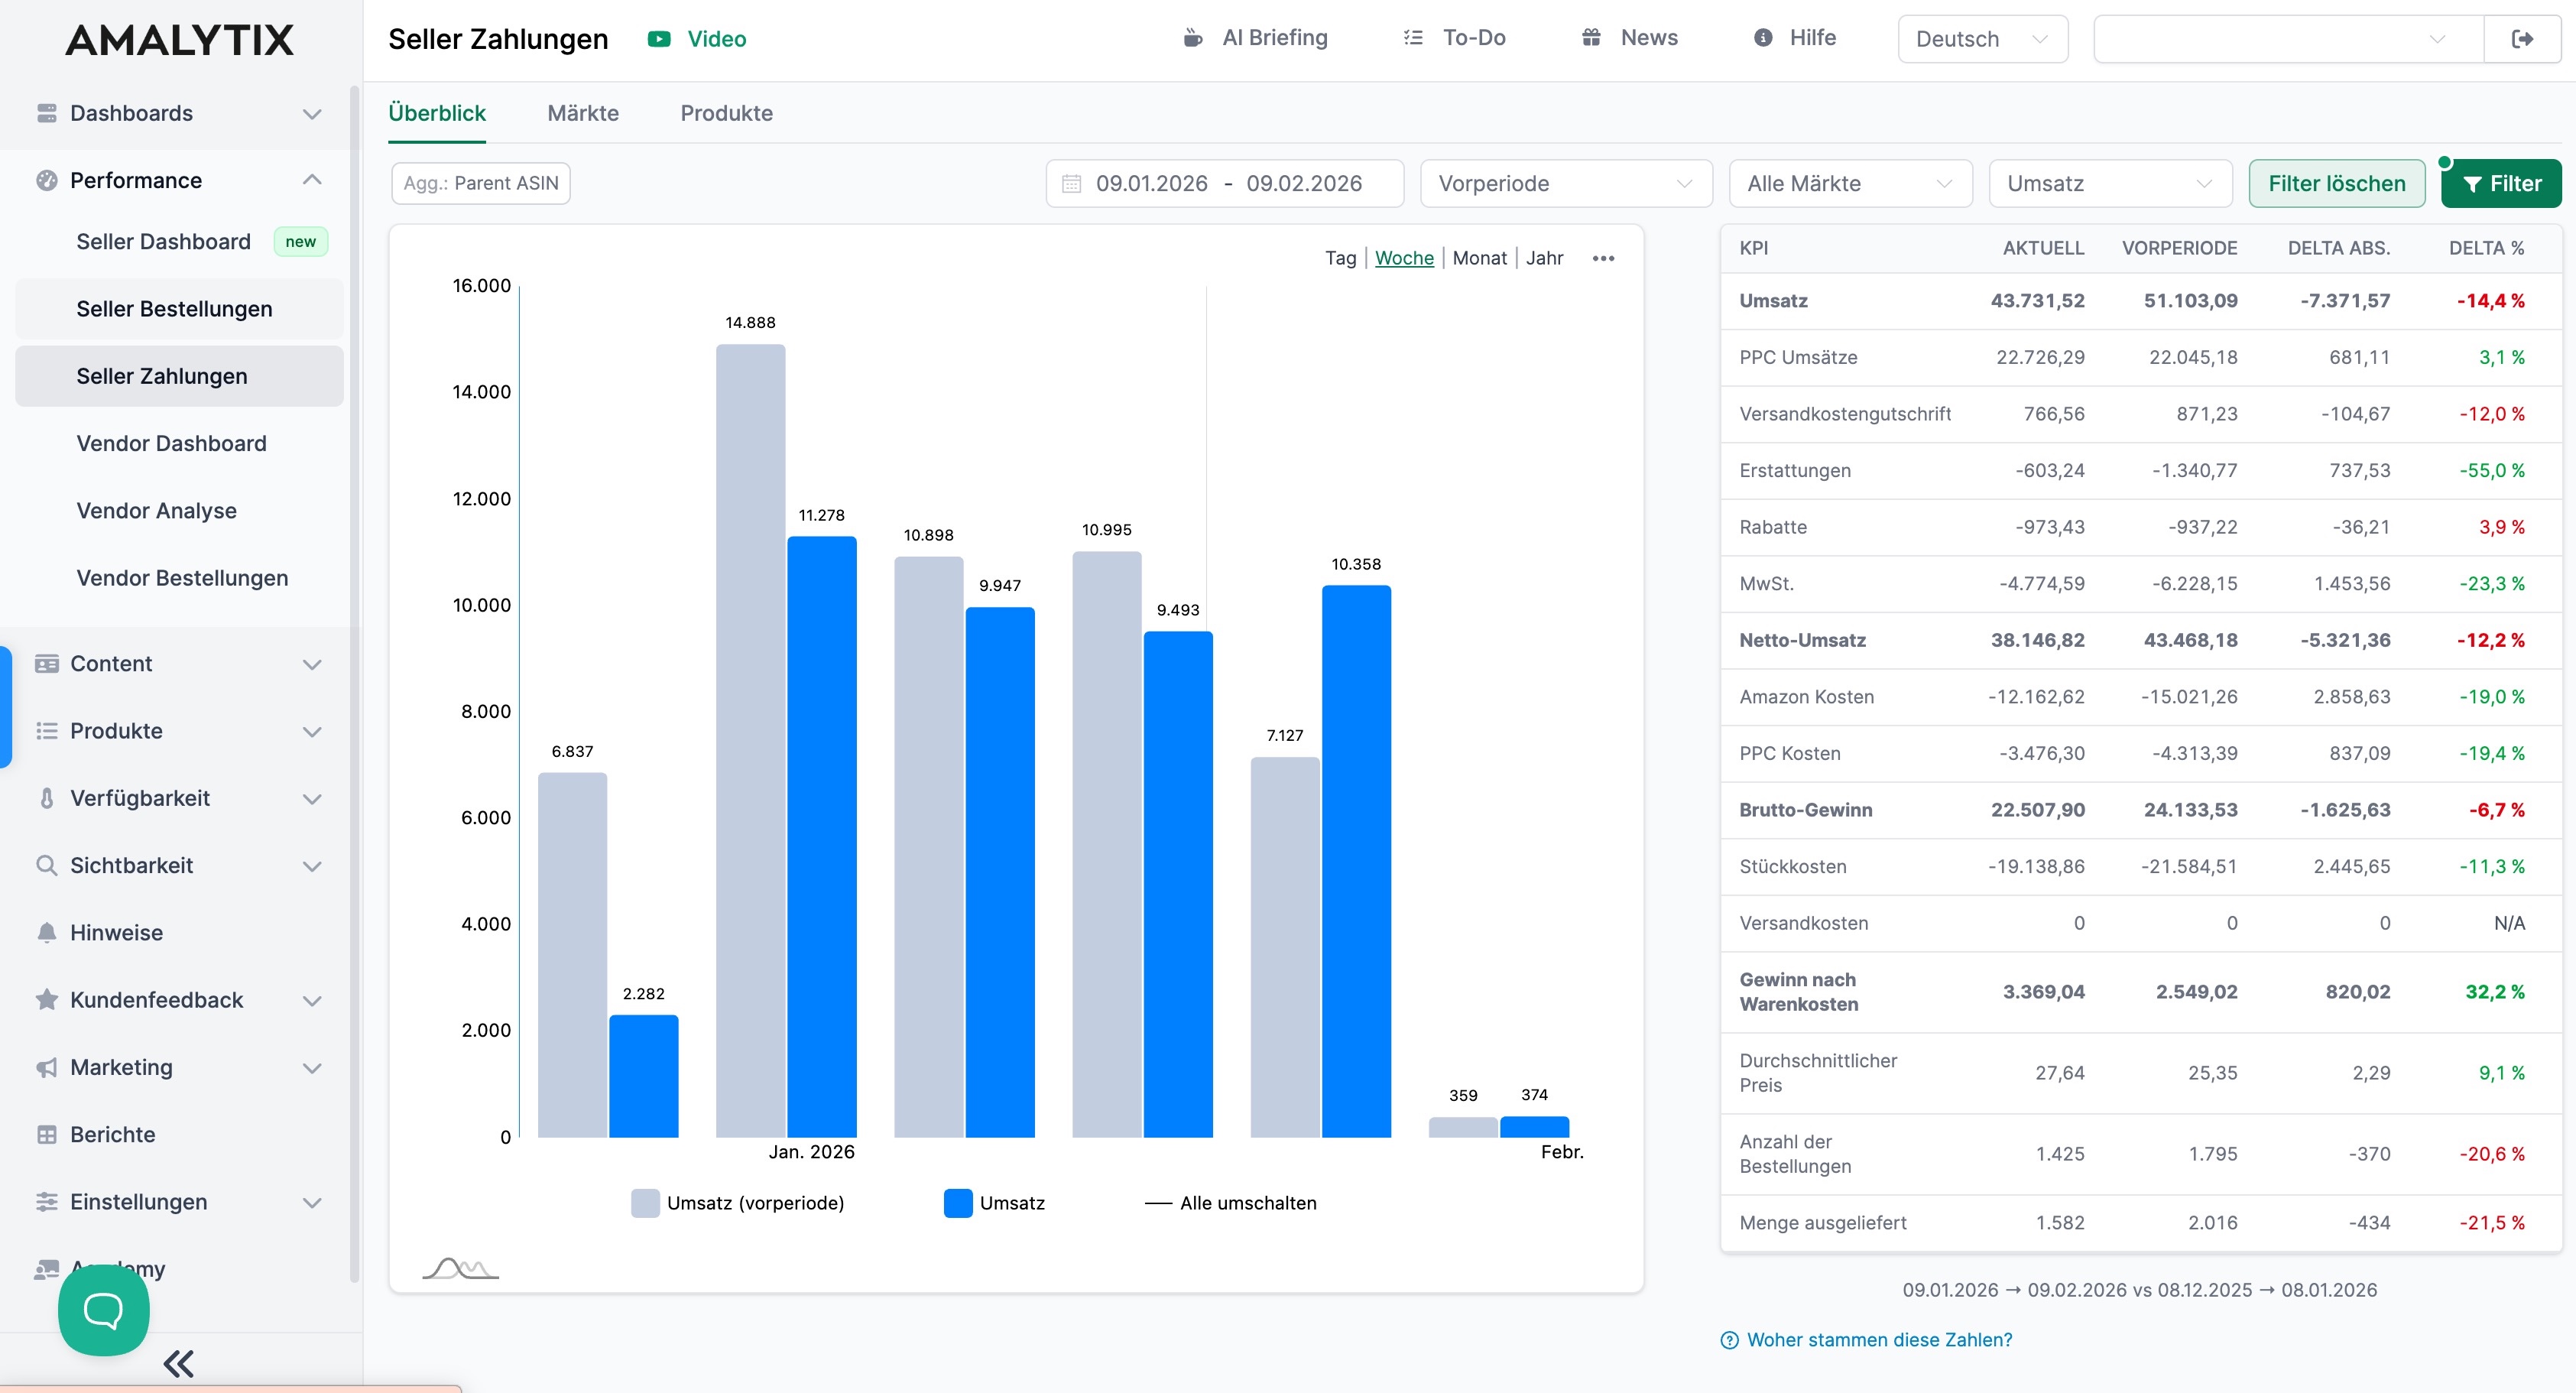
In the Overview tab, you can evaluate revenue and cost metrics over a defined period and compare them with a previous period.
- Revenue: Your total income from sales
- PPC Revenue: Revenue generated through paid advertising
- Shipping credit: Credits for shipping costs
- Refunds: Refunded amounts
- Discounts: Price reductions, e.g., coupons
- VAT: Value added tax
- Net Revenue: Revenue after deducting VAT, discounts, refunds
- Amazon Costs: All fees charged by Amazon
- PPC Costs: Advertising costs for paid ad campaigns
- Gross Profit: Profit after deducting Amazon costs and PPC costs from net revenue
- Shipping Costs: Costs for shipping and logistics, if not already billed through Amazon
- Profit after COGS: Actual profit after deducting all direct costs including cost of goods
- Average Price: Average selling price per unit sold
- Number of Orders: Total number of orders received in the period
- Units Shipped: Total number of units shipped in the period
The chart shows the time progression of the selected metric. You can switch the view to days, weeks, or months.
The table shows for each metric:
- The current value for the selected period
- The value of the comparison period (previous period or previous year)
- The absolute difference between both values
- The percentage change
Markets
In the Markets tab, you compare performance across different Amazon marketplaces. Here you see not just revenue, but the complete economic development of your account within the selected period.
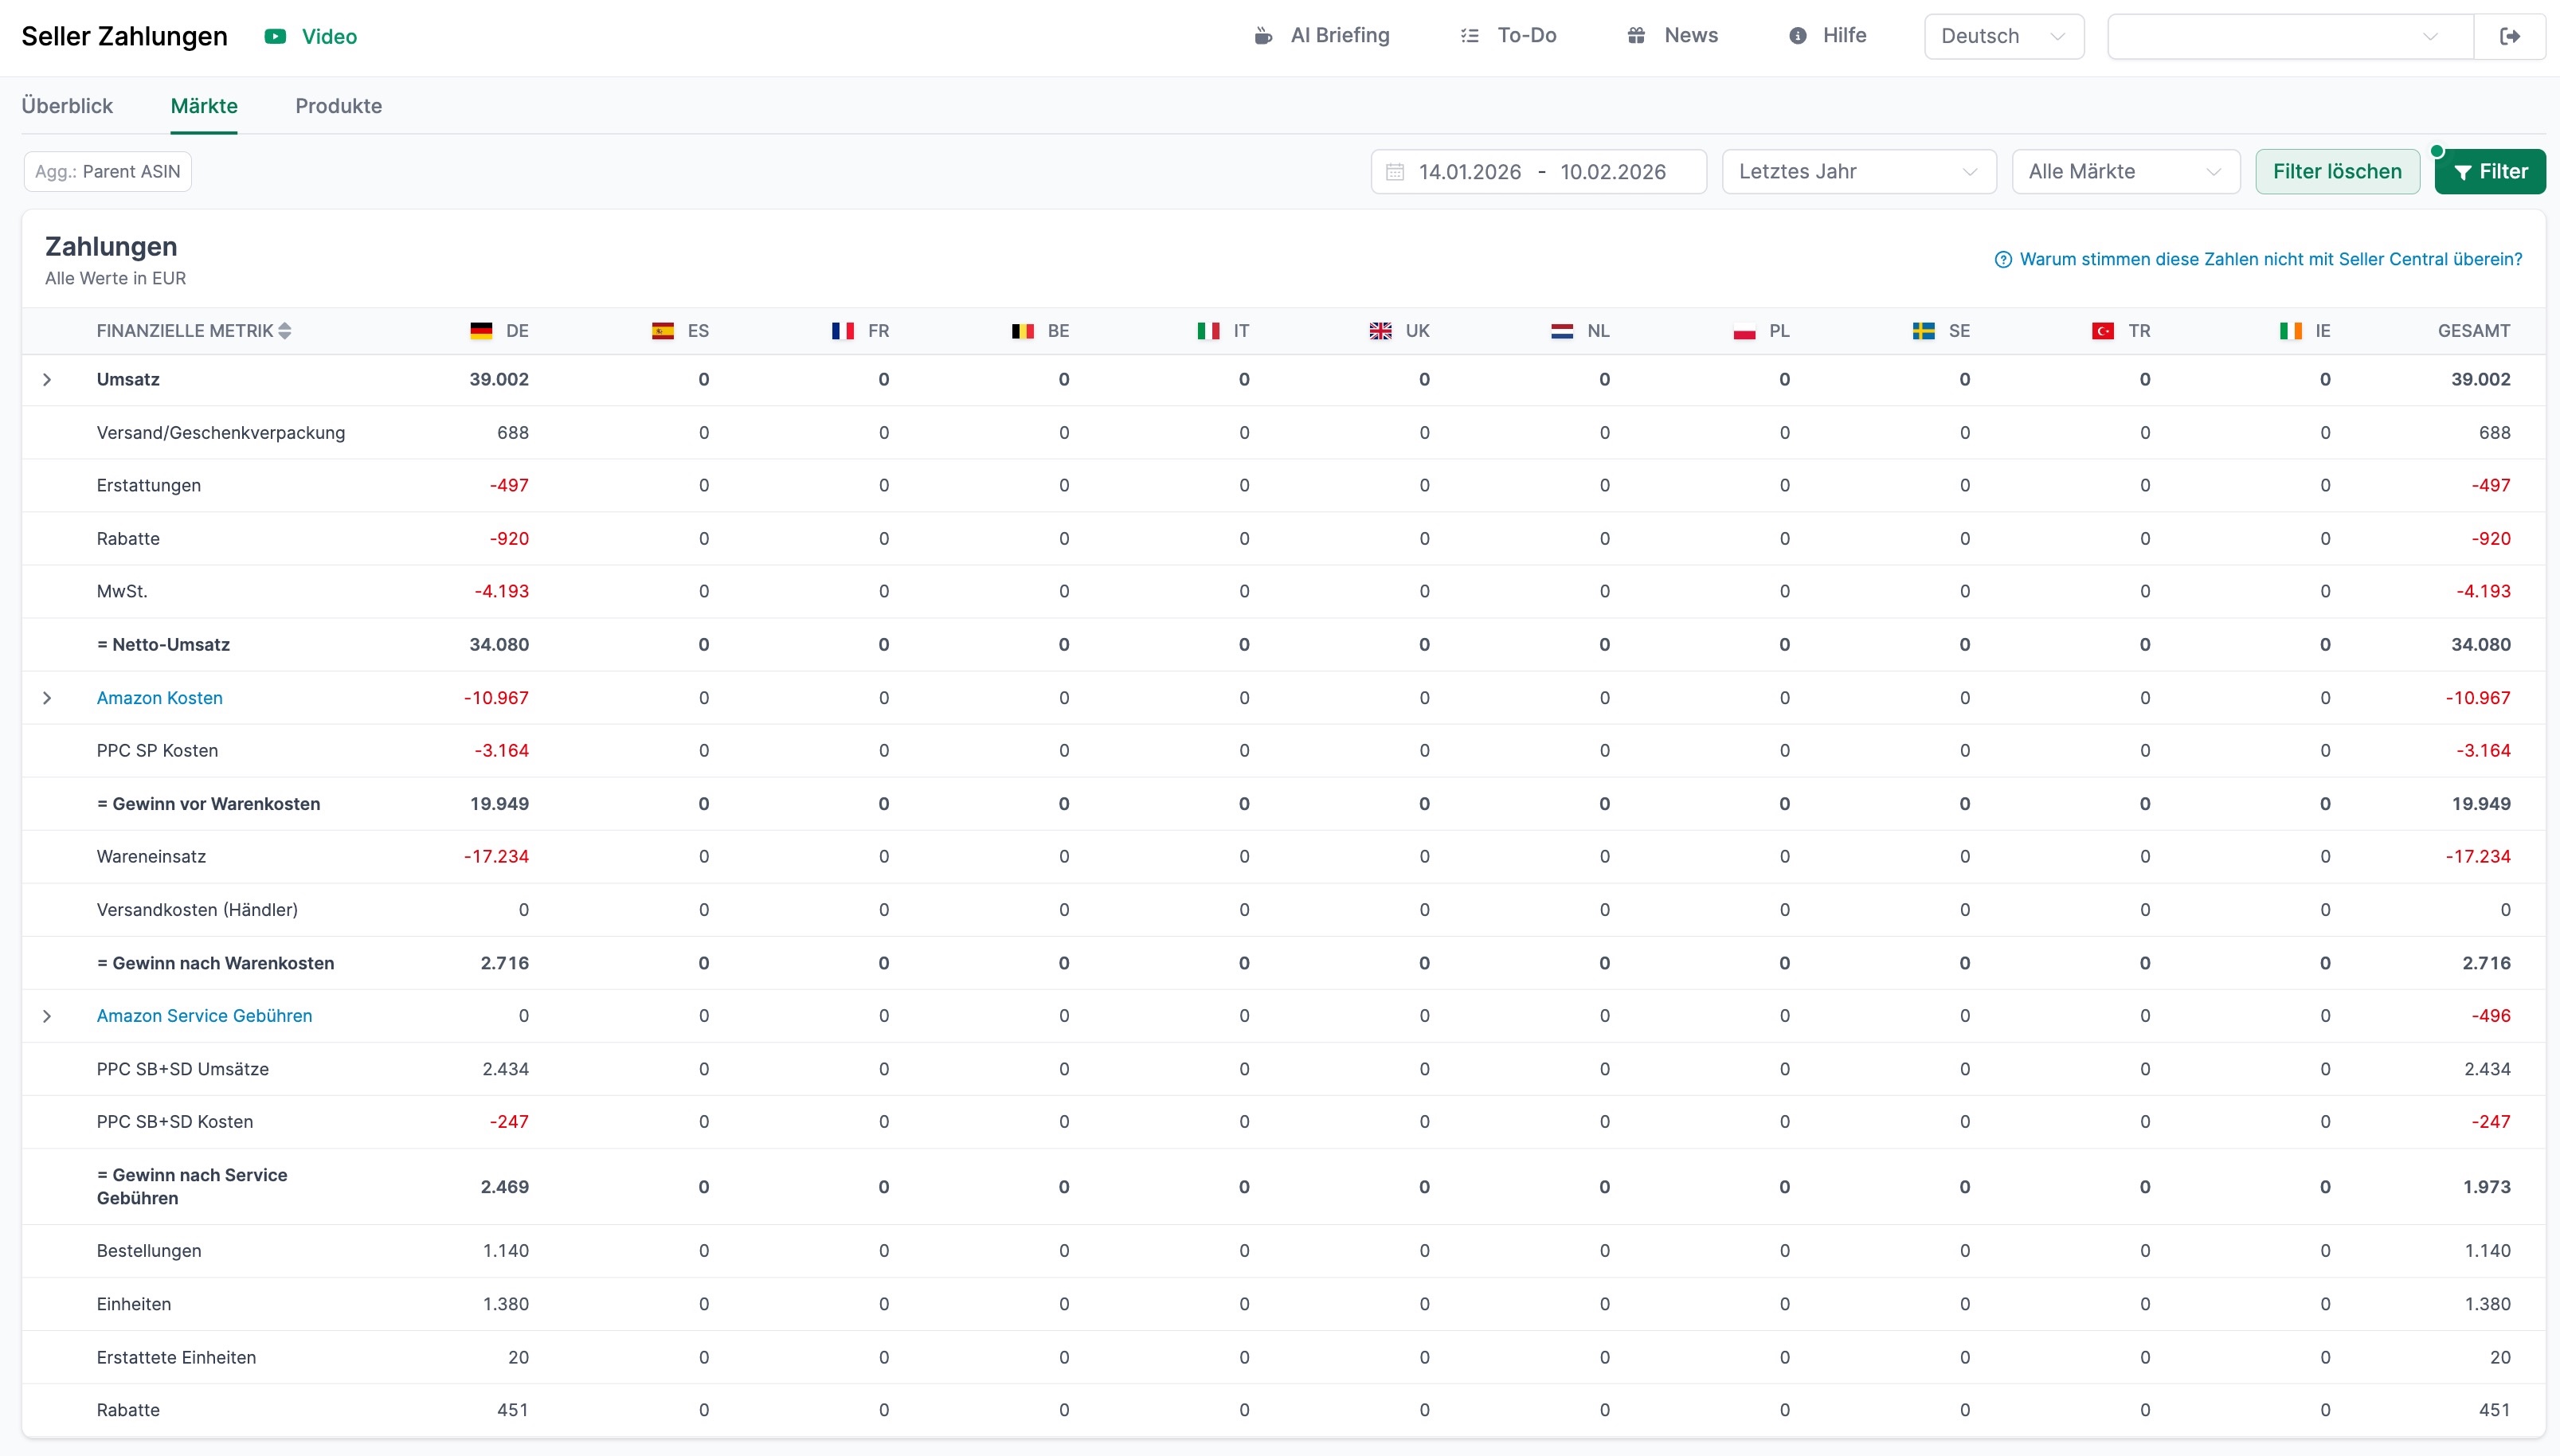
What you can specifically identify:
-
Revenue per marketplace including shipping share
-
Deductions such as refunds, discounts, and sales tax
-
The resulting net revenue
-
Amazon costs as well as separately shown PPC costs
-
Your profit before and after cost of goods
-
Additional service fees and their impact on the result
-
Relevant performance metrics such as orders, units, and returns
Through the country breakdown, you can immediately see in which markets revenue was generated and where there was no activity. At the same time, you can see how strongly individual cost blocks affect your margin.
Products
Here you see the product-level evaluation of your seller payments. Unlike the market view, the metrics here are displayed at the ASIN level - including the direct profit impact per product.
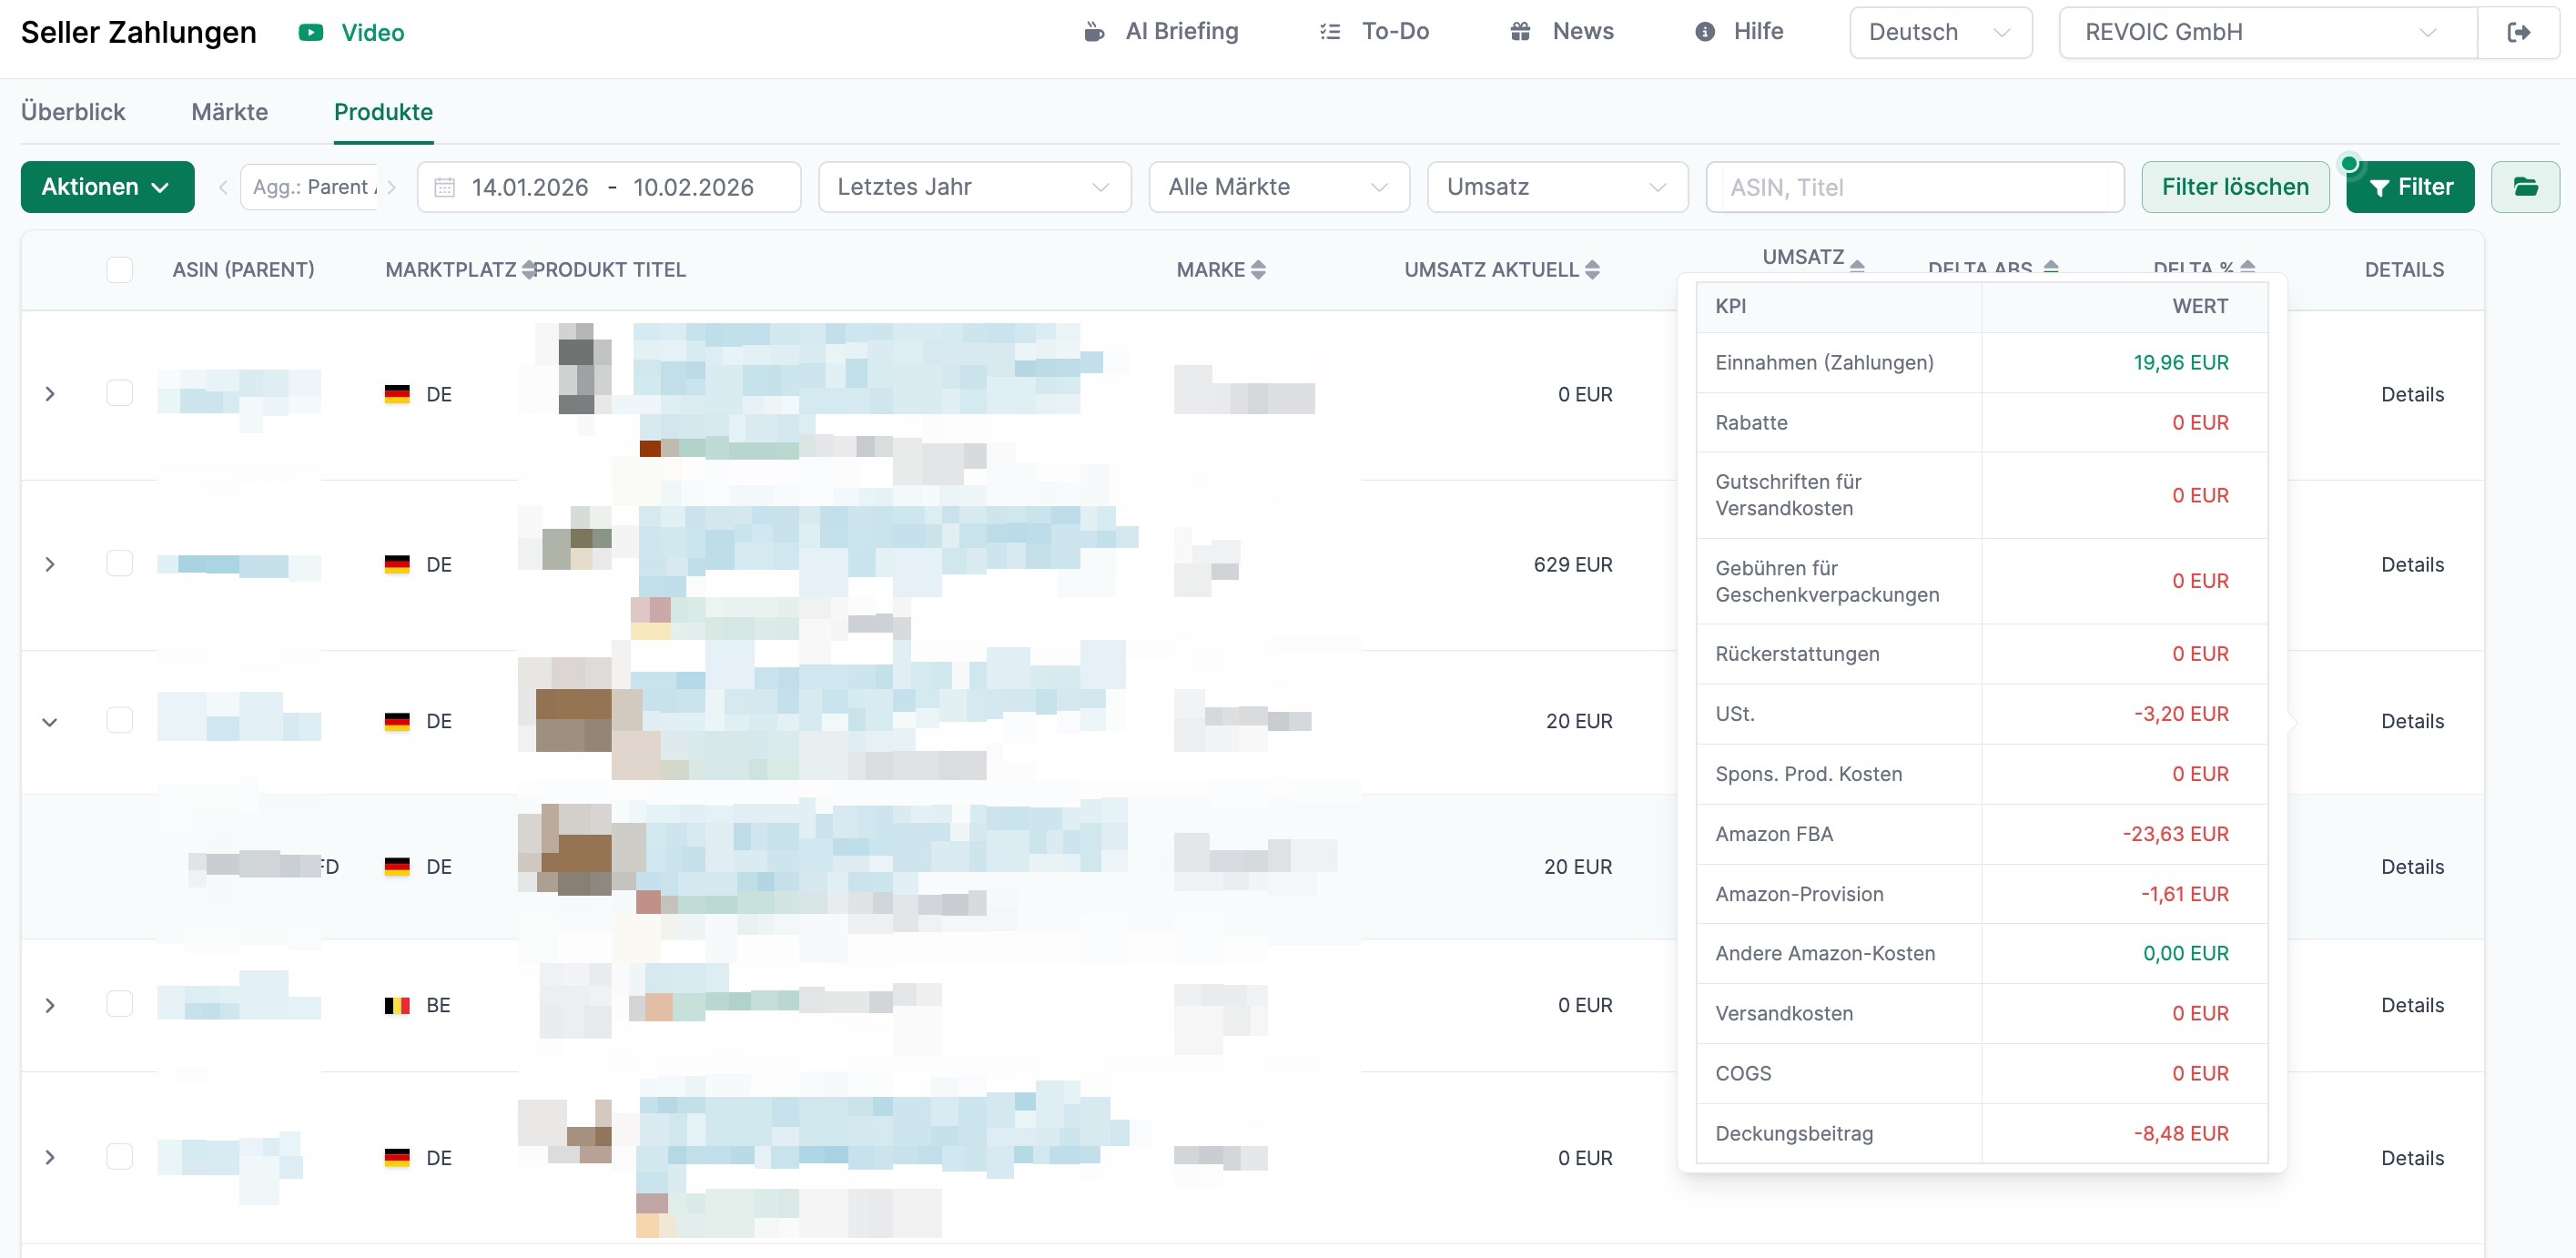
For each product you can see:
-
The current revenue in the selected period
-
Changes compared to the comparison period (delta absolute and percentage)
-
The respective brand and marketplace
Through the detail view, you can open a complete KPI breakdown for an individual product. Click the small arrow on the left side and then click Details. You will then see, among other things:
-
Income from payouts
-
Discounts and refunds
-
Sales tax
-
Advertising costs (e.g., Sponsored Products)
-
FBA fees and selling commission
-
Other Amazon costs
-
Cost of goods (COGS)
-
The resulting contribution margin
This makes it immediately visible which product is working profitably and which is not.
Filter Settings
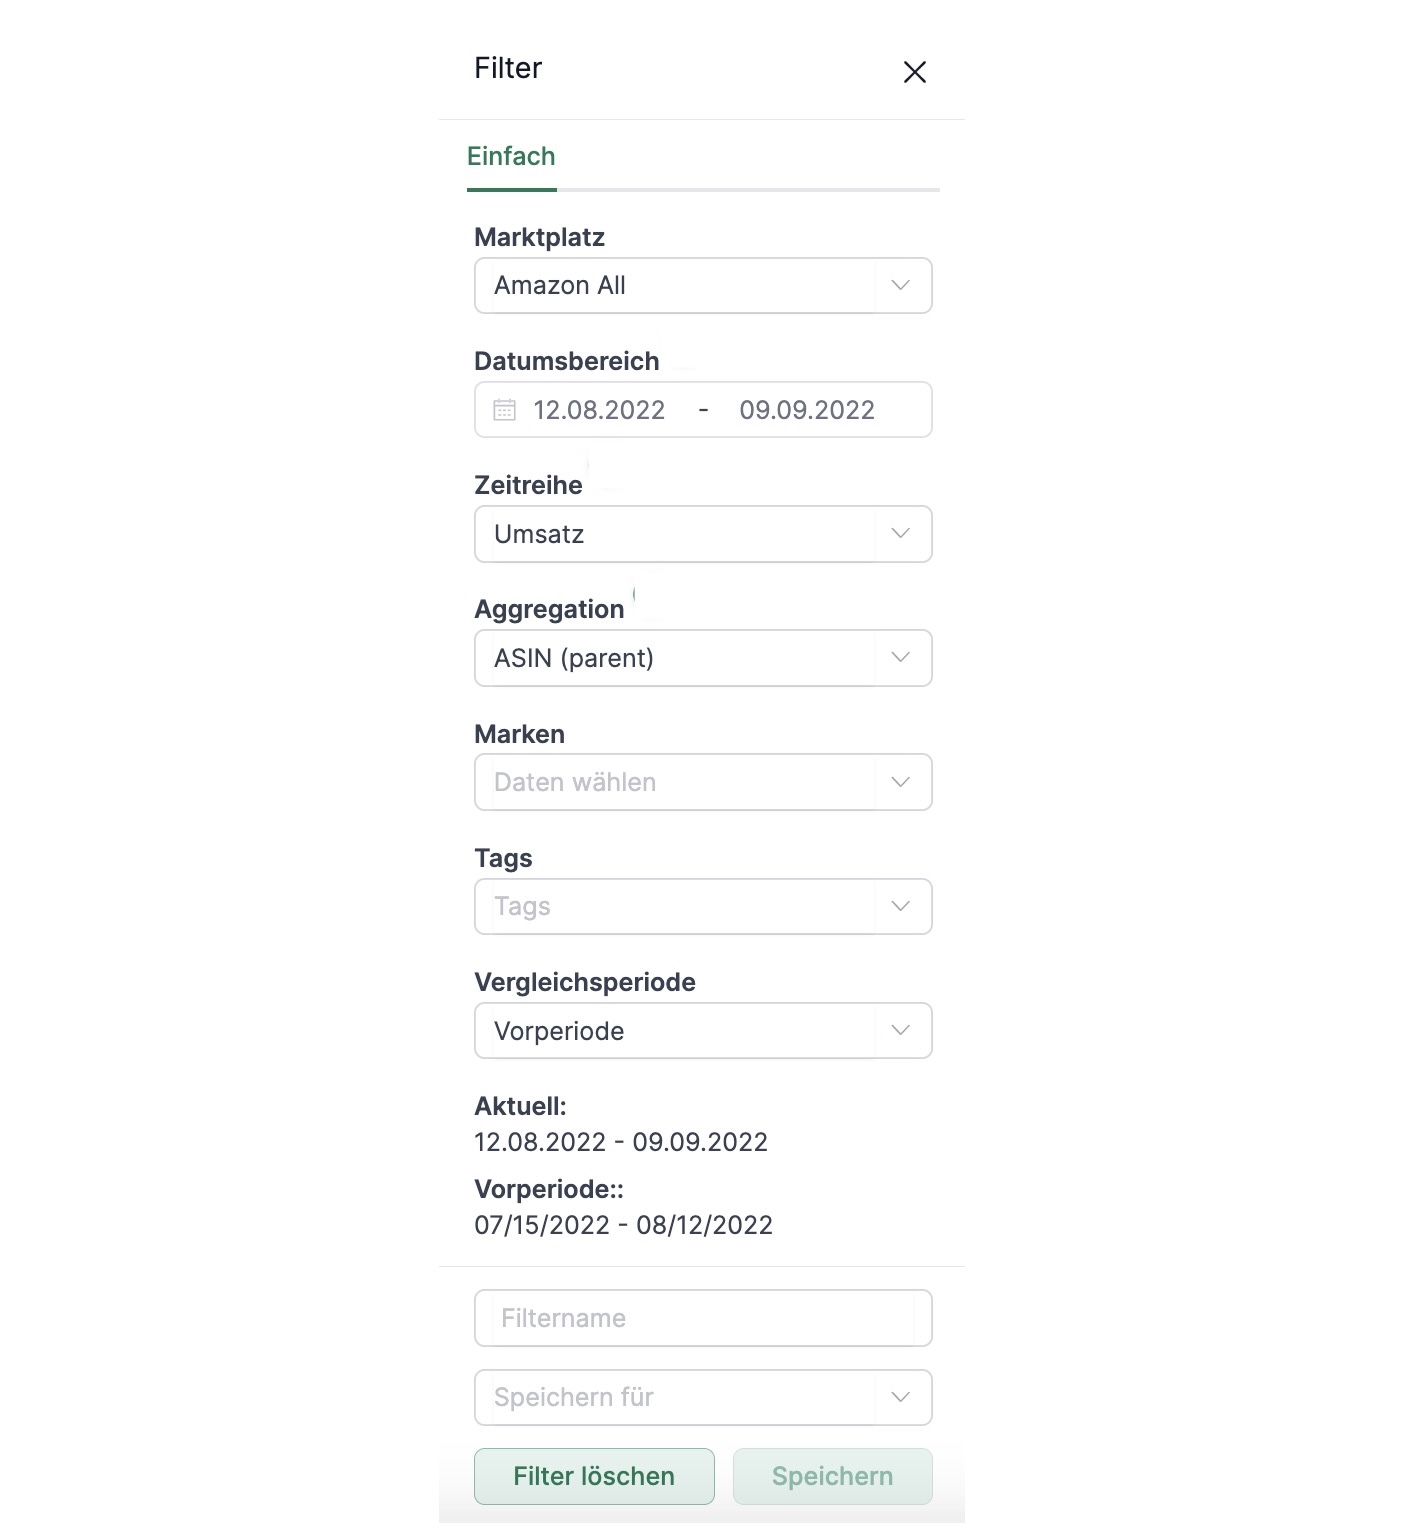
To use the module effectively, set the following filters:
- Date Range: Select the time period you want to analyze (e.g., the last 28 days)
- Comparison Period: Choose what to compare against:
- Previous Period: Comparison with the same length period immediately before
- Last Year: Comparison with the same period last year
- Market: Filter by a specific marketplace or view all markets
- Brands: Filter by specific brands
- Tags: Filter by your own product tags
- KPI: In the “Brands” and “Markets” tabs, you can select the displayed metric (e.g., Revenue, Units, Sessions)
Amazon Reports
You can also export specific metrics as a report. Simply go to Reports in the left navigation and scroll to the Period Comparison or Payments report. Set the appropriate marketplace and start and end dates if needed to narrow the results.
Period Comparison Report
- Description: This report compares key performance metrics between two time periods you define. Compared are order data, financial data, listing data, and session and conversion data.
- Type: Seller
- Category: Performance
Payments Report
- Description: Contains payments from sales, refunds, fees, and PPC
- Type: Seller
- Category: Performance
A list of all columns of the Period Comparison report can be found here.
A list of all columns of the Payments report can be found here.
Related Pages
- Seller Dashboard - Daily performance overview
- Seller Orders - View individual orders
- Seller Payments - Analyze payment details
- Reports - Export data