Vendor Dashboard
The Vendor Dashboard provides a comprehensive overview of your Amazon Vendor account performance. Analyze revenue, compare markets, and identify your top products - all in one place.
The following video gives you a good overview:
Market Overview
The Market Overview is your central hub for the most important vendor metrics.
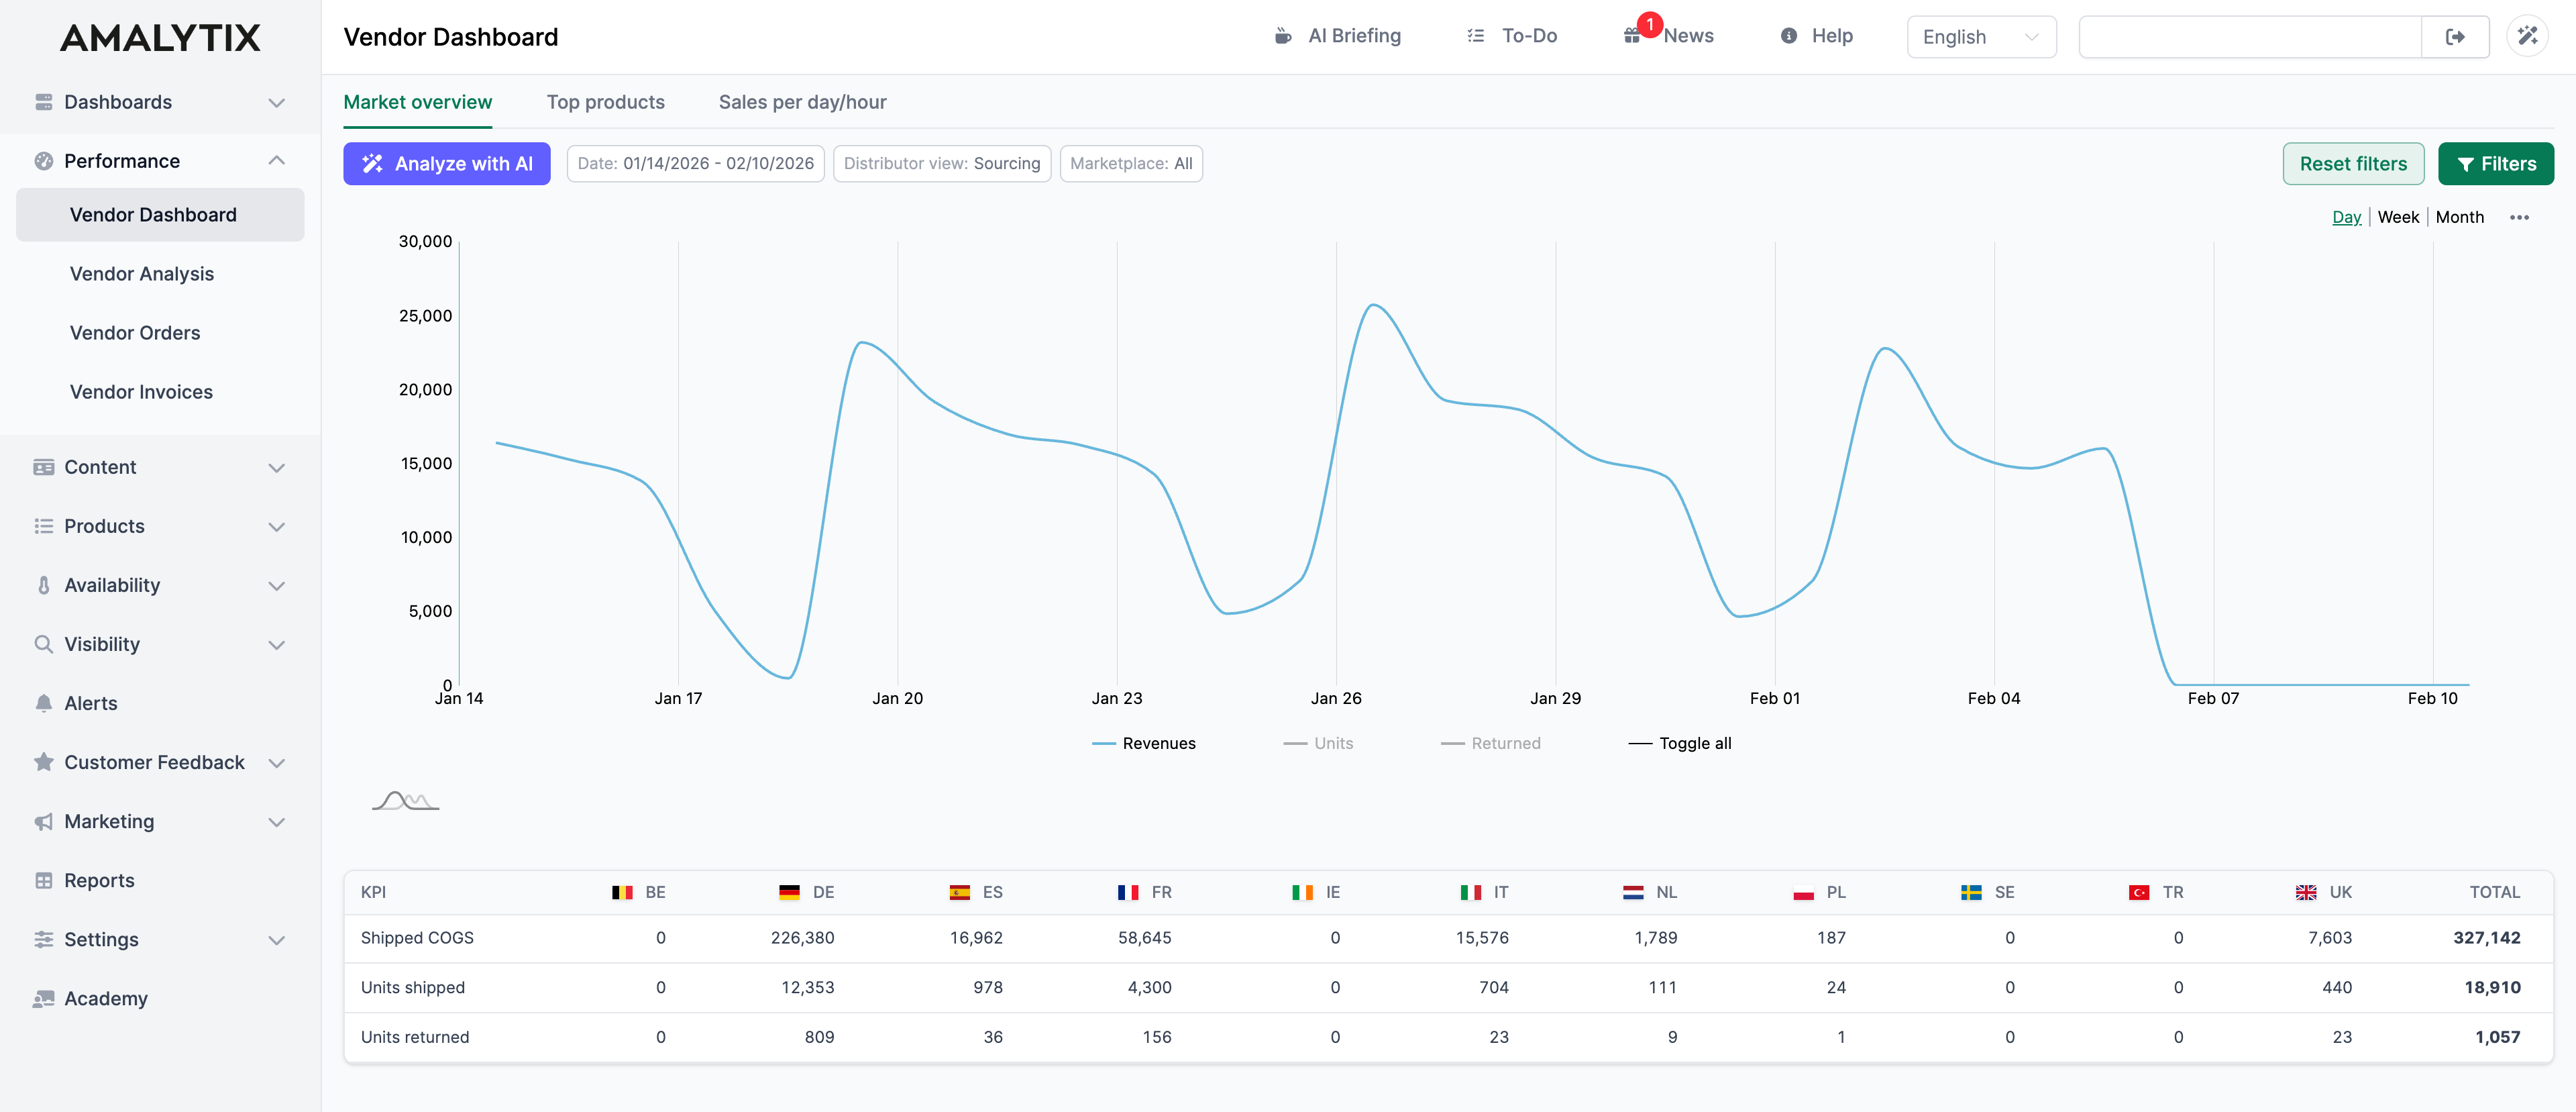
The Chart
The chart shows how your metrics evolve over time. You can choose between different time groupings:
- Day: Daily values for detailed analysis
- Week: Weekly aggregation for medium-term trends
- Month: Monthly overview for long-term developments
Available metrics:
| Metric | Description | Why it matters |
|---|---|---|
| Revenue | Revenue from orders | Shows your business success |
| Units | Units sold | Important for inventory planning |
| Units Received Back | Returned units | Shows return rate |
Click on the legend to show or hide individual metrics.
The Markets Table
The table below the chart shows the key metrics per marketplace:
| Metric | Description |
|---|---|
| COGS (Shipped) | Cost of Goods Sold (shipped) |
| Units | Number of units sold |
| Units Received Back | Returned units |
The Total column sums the values across all markets.
Analyze with AI
The Analyze with AI button opens an AI assistant that automatically evaluates your vendor data.
What the AI does for you:
- Detects trends and unusual changes
- Identifies potential causes for performance fluctuations
- Provides concrete recommendations for action
Filter Options
Use the filter bar to narrow down the displayed data:
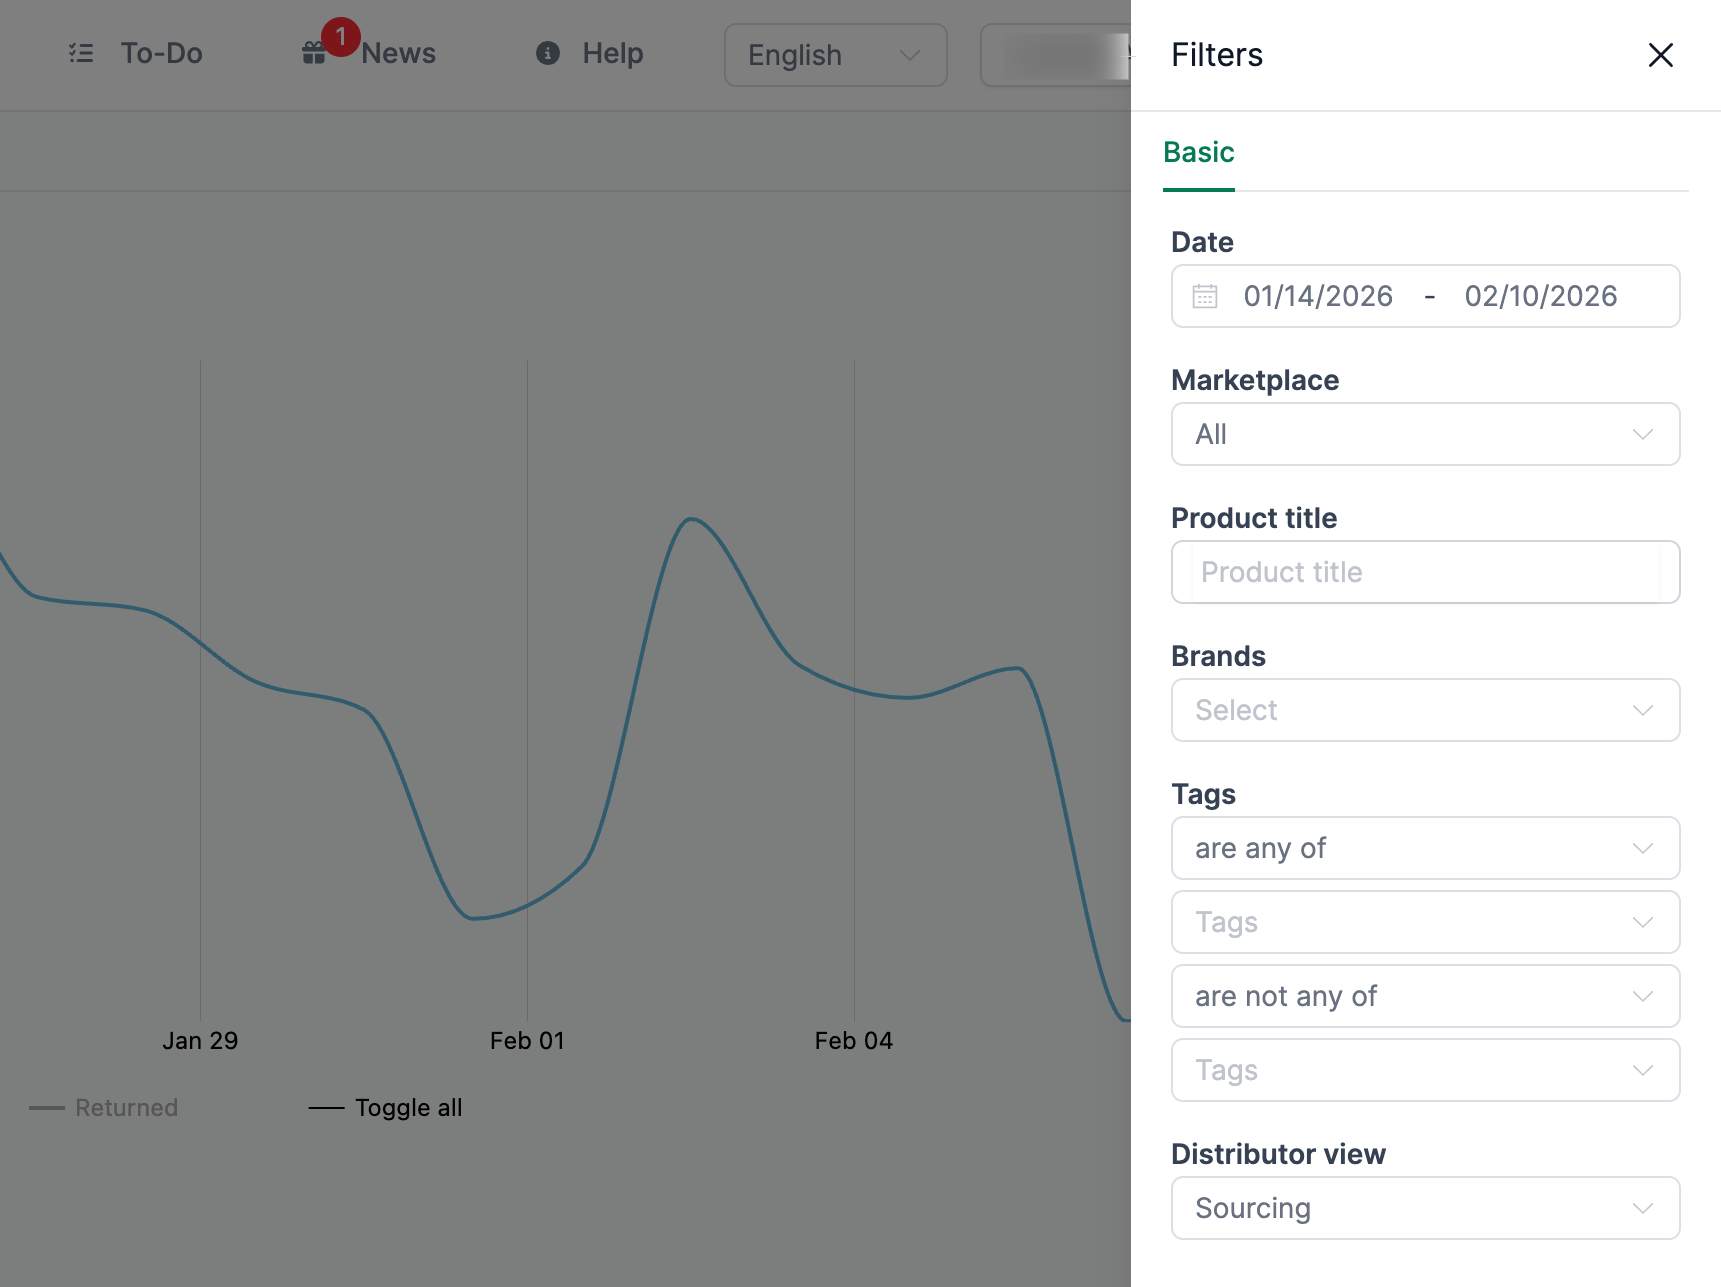
Available filters:
- Date range: Select start and end date
- Distributor view: Switch between Sourcing and other views
- Marketplace: Select all markets or individual countries
- Brands: Filter by your brands
- Tags: Analyze product groups via tags
Top Products
In the Top Products tab, you can see your highest-revenue and best-selling products.
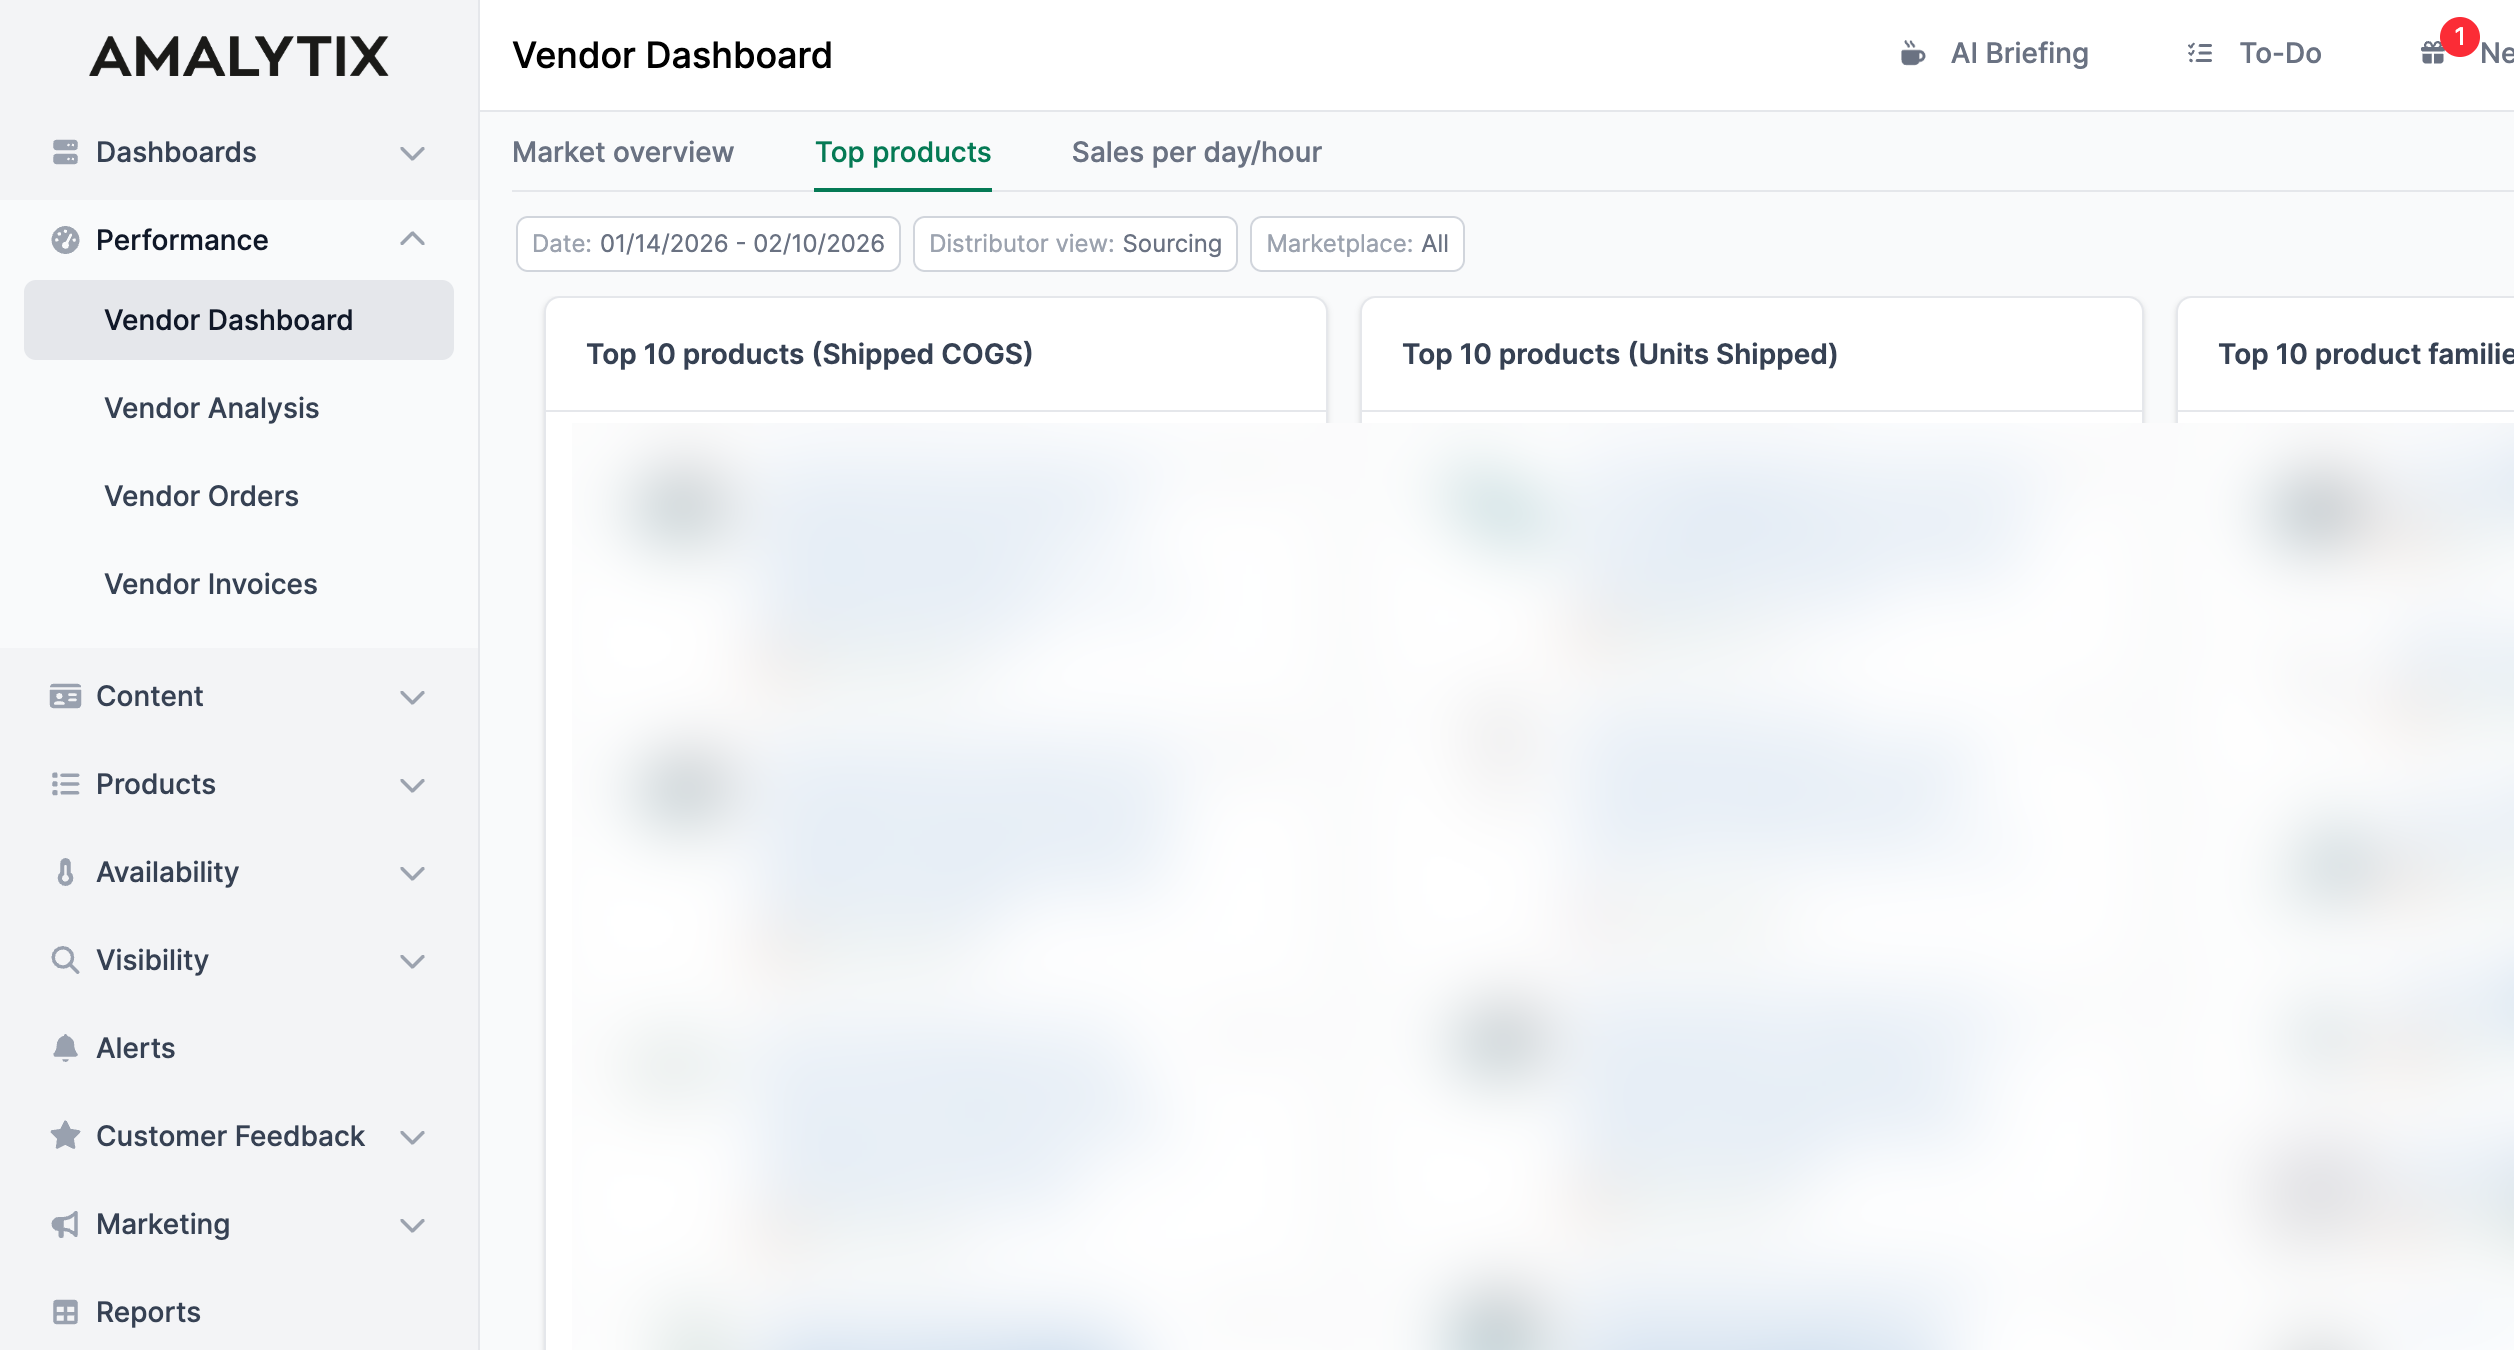
This view shows you:
- Top 10 by Revenue: Products with the highest revenue in the selected period
- Top 10 by Units: Products with the most units sold
You can switch between parent products (main products with variants) and child products (individual variants).
Use this view to:
- Identify your bestsellers
- Focus on high-revenue products
- Spot trends in your top products
Sales per Day/Hour
The Sales per Day/Hour tab provides granular analysis of your sales on an hourly basis.
Available Metrics
You can analyze the following metrics on an hourly basis:
- Conversion Rate: Percentage of visitors who make a purchase
- Glance Views: Product page views
- Ordered Revenue: Order revenue per hour
- Ordered Units: Units sold per hour
Grouping Options
Data can be grouped in different ways:
| Grouping | Description | Use Case |
|---|---|---|
| Day | Revenue per hour for each individual day | Detailed analysis of specific days |
| Week | Revenue per hour, aggregated by calendar week | Identify weekly patterns |
| Month | Revenue per hour, aggregated by month | Monthly trends |
| Weekday | Sums all revenue for the same weekday | Which weekday performs best? |
| Month Day | Sums all revenue for the same calendar day | Are there patterns on specific days of the month? |
Typical insights:
- At what times do your customers buy the most?
- Are there differences between weekdays?
- When should you intensify advertising campaigns?
Related Features
- Vendor Analysis: Detailed product analysis for vendors
- Vendor Orders: Overview of your Amazon orders
- Reports: Export your data as a report