Seller Dashboard
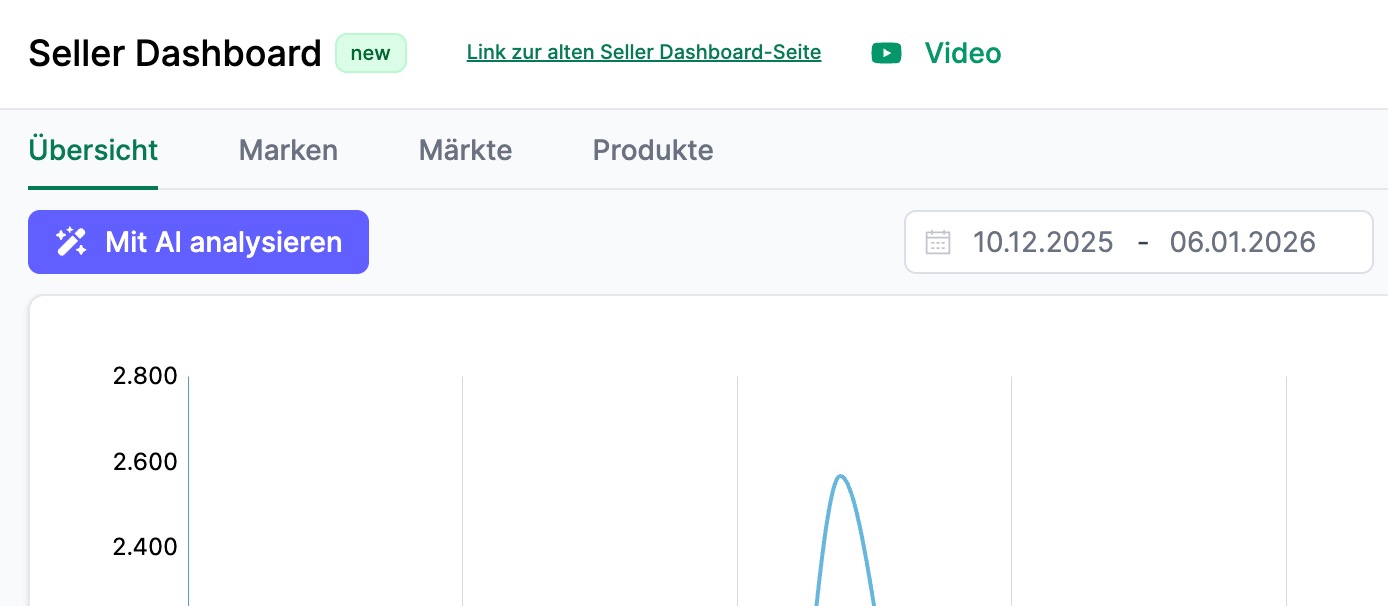
The Seller Dashboard is your central cockpit for analyzing your Amazon business. At a glance, you can see how revenue, orders, and other key metrics are developing - and quickly identify which brands and products are performing well or need attention.
Overview
What Does the Overview Show?
The Overview page provides a comprehensive view of the most important metrics for your Seller account.
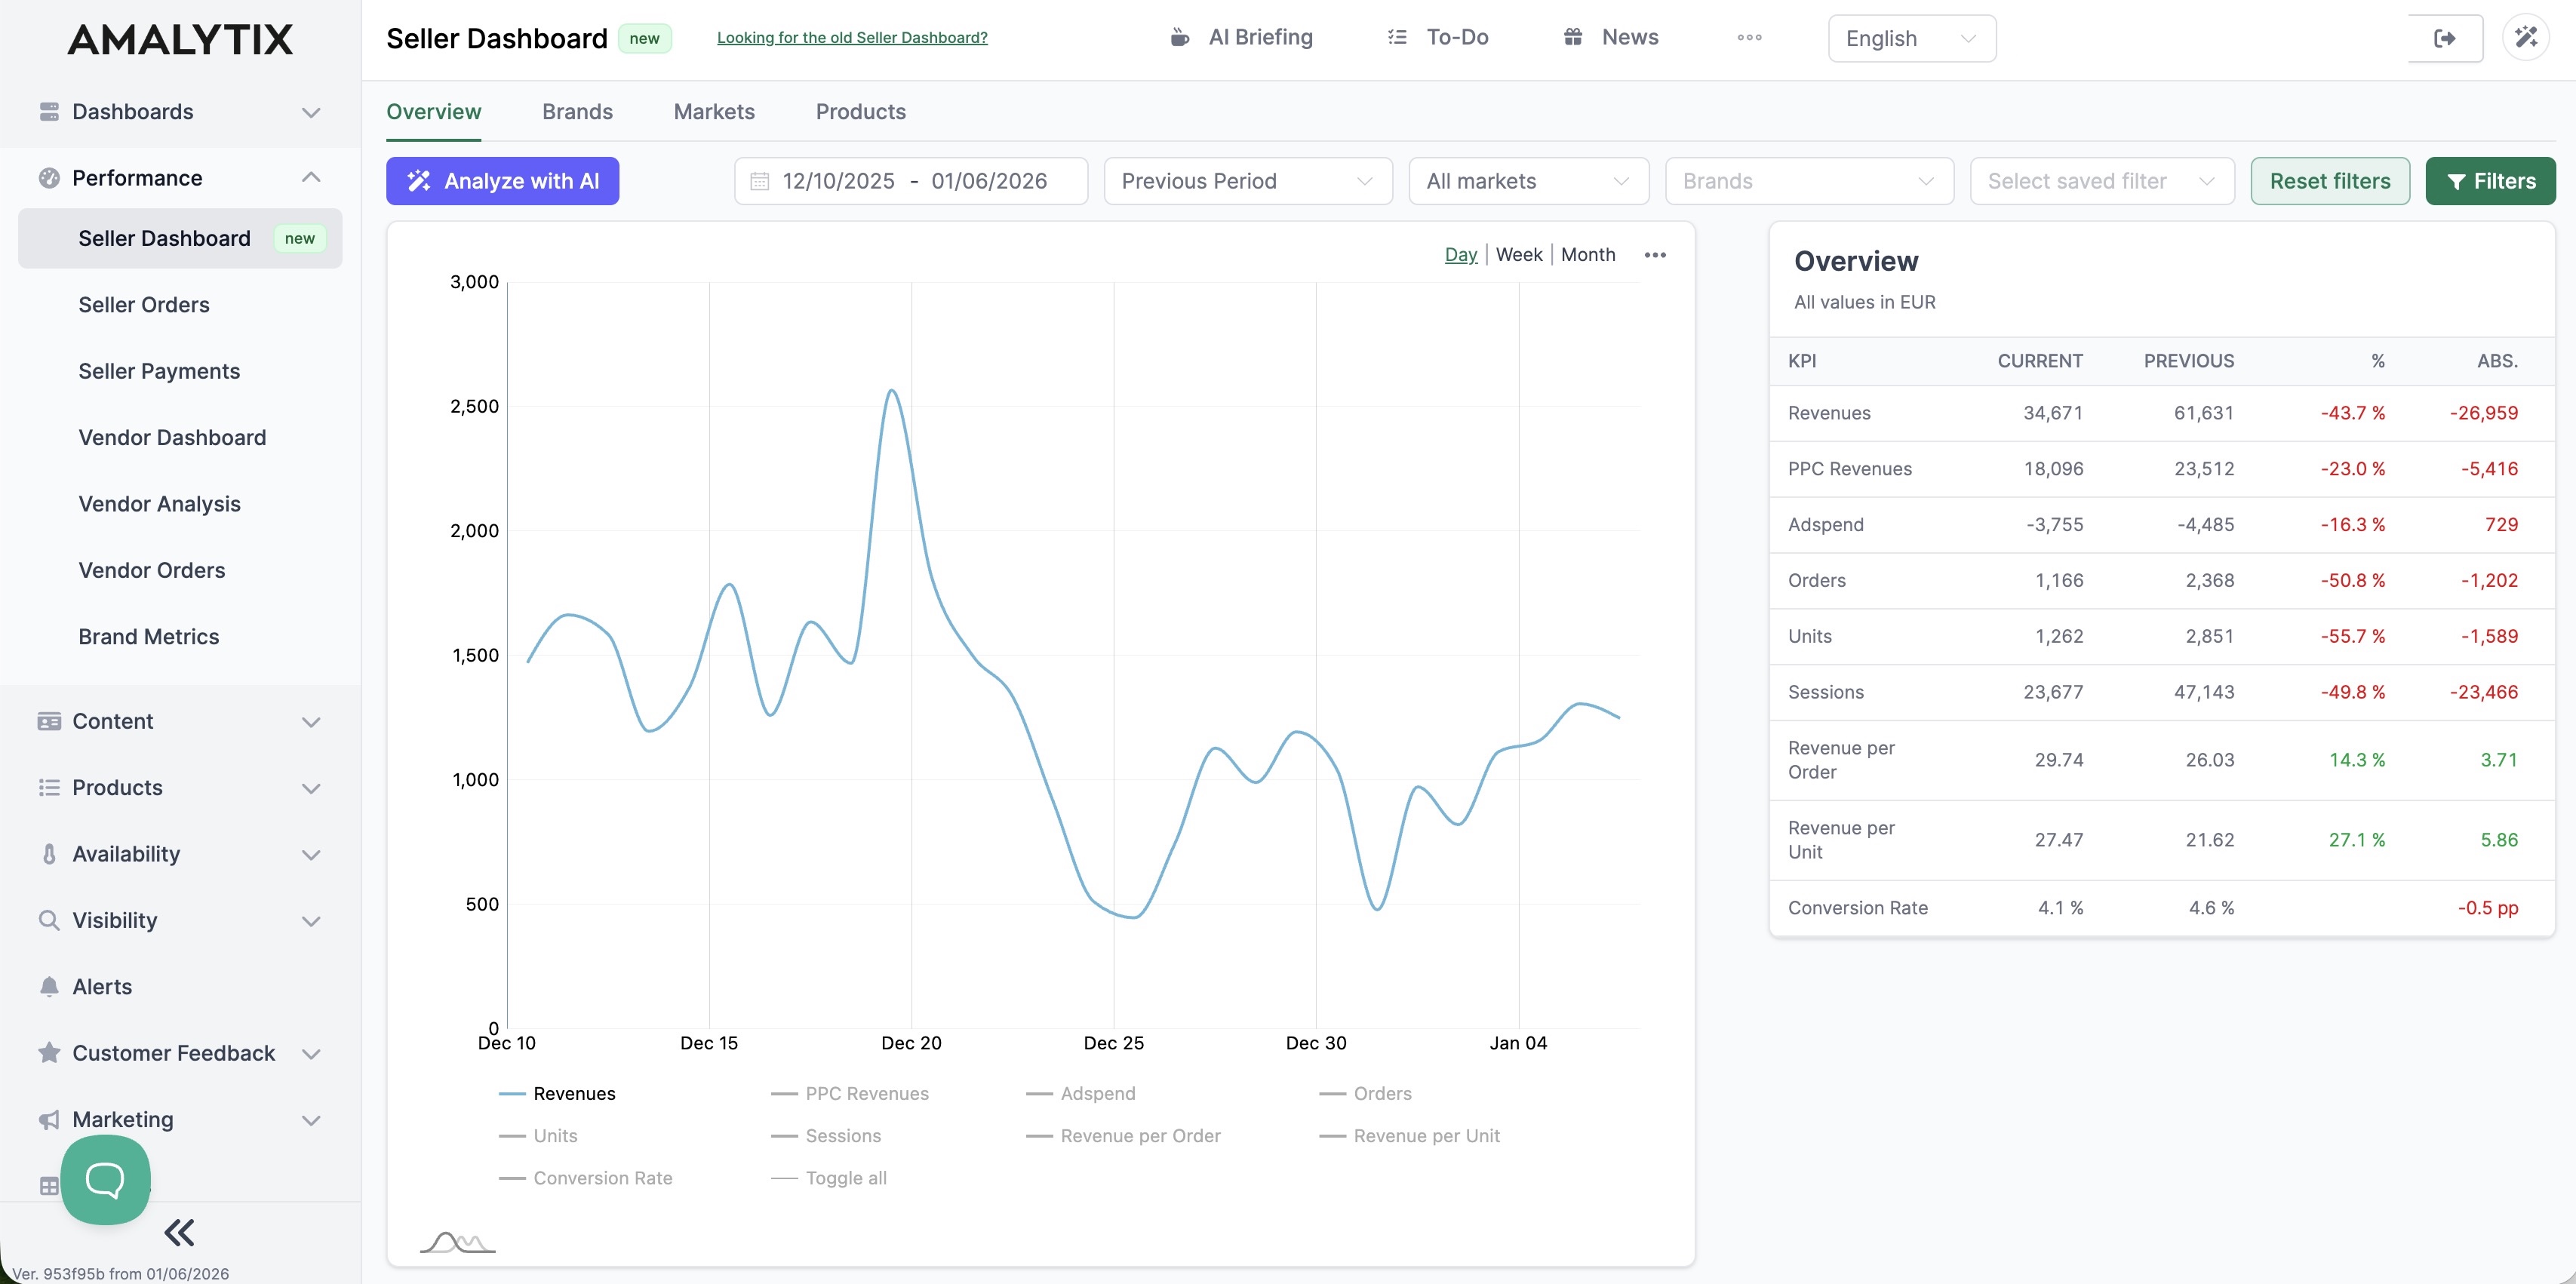
The chart visualizes how your metrics evolve over time. You can choose between different time groupings:
- Day: Daily values for detailed analysis
- Week: Weekly aggregation for medium-term trends
- Month: Monthly overview for long-term developments
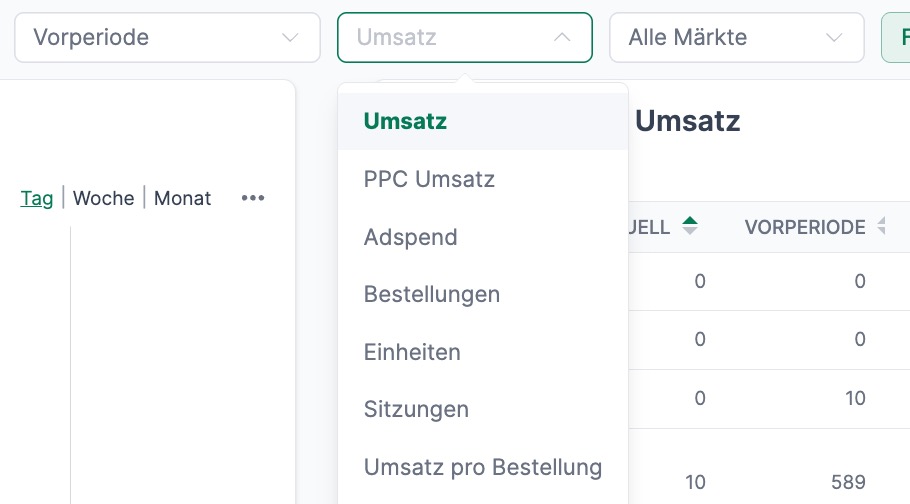
Available metrics in the chart:
| Metric | Description | Why it matters |
|---|---|---|
| Revenue | Total revenue from orders | Shows your business success |
| PPC Revenue | Revenue from PPC advertising | Measures your ad campaign effectiveness |
| Ad Spend | Advertising expenses | Helps control costs |
| Orders | Number of orders | Indicates demand |
| Units | Units sold | Important for inventory planning |
| Sessions | Visitor count | Shows interest in your products |
| Revenue per Order | Average order value | Reveals cross-selling potential |
| Revenue per Unit | Average unit price | Helps with pricing optimization |
| Conversion Rate | Percentage of visitors who buy | Measures purchase readiness |
Click on the legend below the chart to show or hide individual metrics.
The table on the right shows all metrics with:
- Current: Value for the selected period
- Previous: Comparison value
- %: Percentage change
- Abs.: Absolute difference
Filters and Settings
Use the filter bar to narrow down your data:
- Date range: Select start and end date
- Comparison period: Previous period or custom timeframe
- Marketplace: All markets or individual countries (DE, UK, FR, etc.)
- Brands: Filter by your brands
- Tags: Analyze product groups via tags
Analyze with AI
The Analyze with AI button opens an AI assistant that automatically evaluates your data.
What the AI does for you:
- Detects trends and unusual changes
- Identifies potential causes for performance fluctuations
- Provides concrete recommendations for action
The analysis takes just a few seconds and delivers a structured summary with actionable insights.
Brands
In the Brands tab, you can compare the performance of your different brands.
How to use this view:
- Select the desired metric (e.g., revenue, units, conversion rate)
- Compare your brands in the chart
- Use the Top 20 Brands table for a ranking
Typical questions you can answer here:
- Which brand is growing the fastest?
- Where are there declines that need attention?
- How is revenue distributed across your brands?
Markets
The Markets tab shows performance across different Amazon marketplaces.

Here you can see:
- Revenue and other metrics per country
- Trends by day, week, or month
- Comparison between marketplaces
Click on individual countries in the legend to show or hide them.
Use this view to:
- Identify growth markets
- Understand regional differences
- Optimize your internationalization strategy
Products
In the Products tab, you analyze performance at the product level.
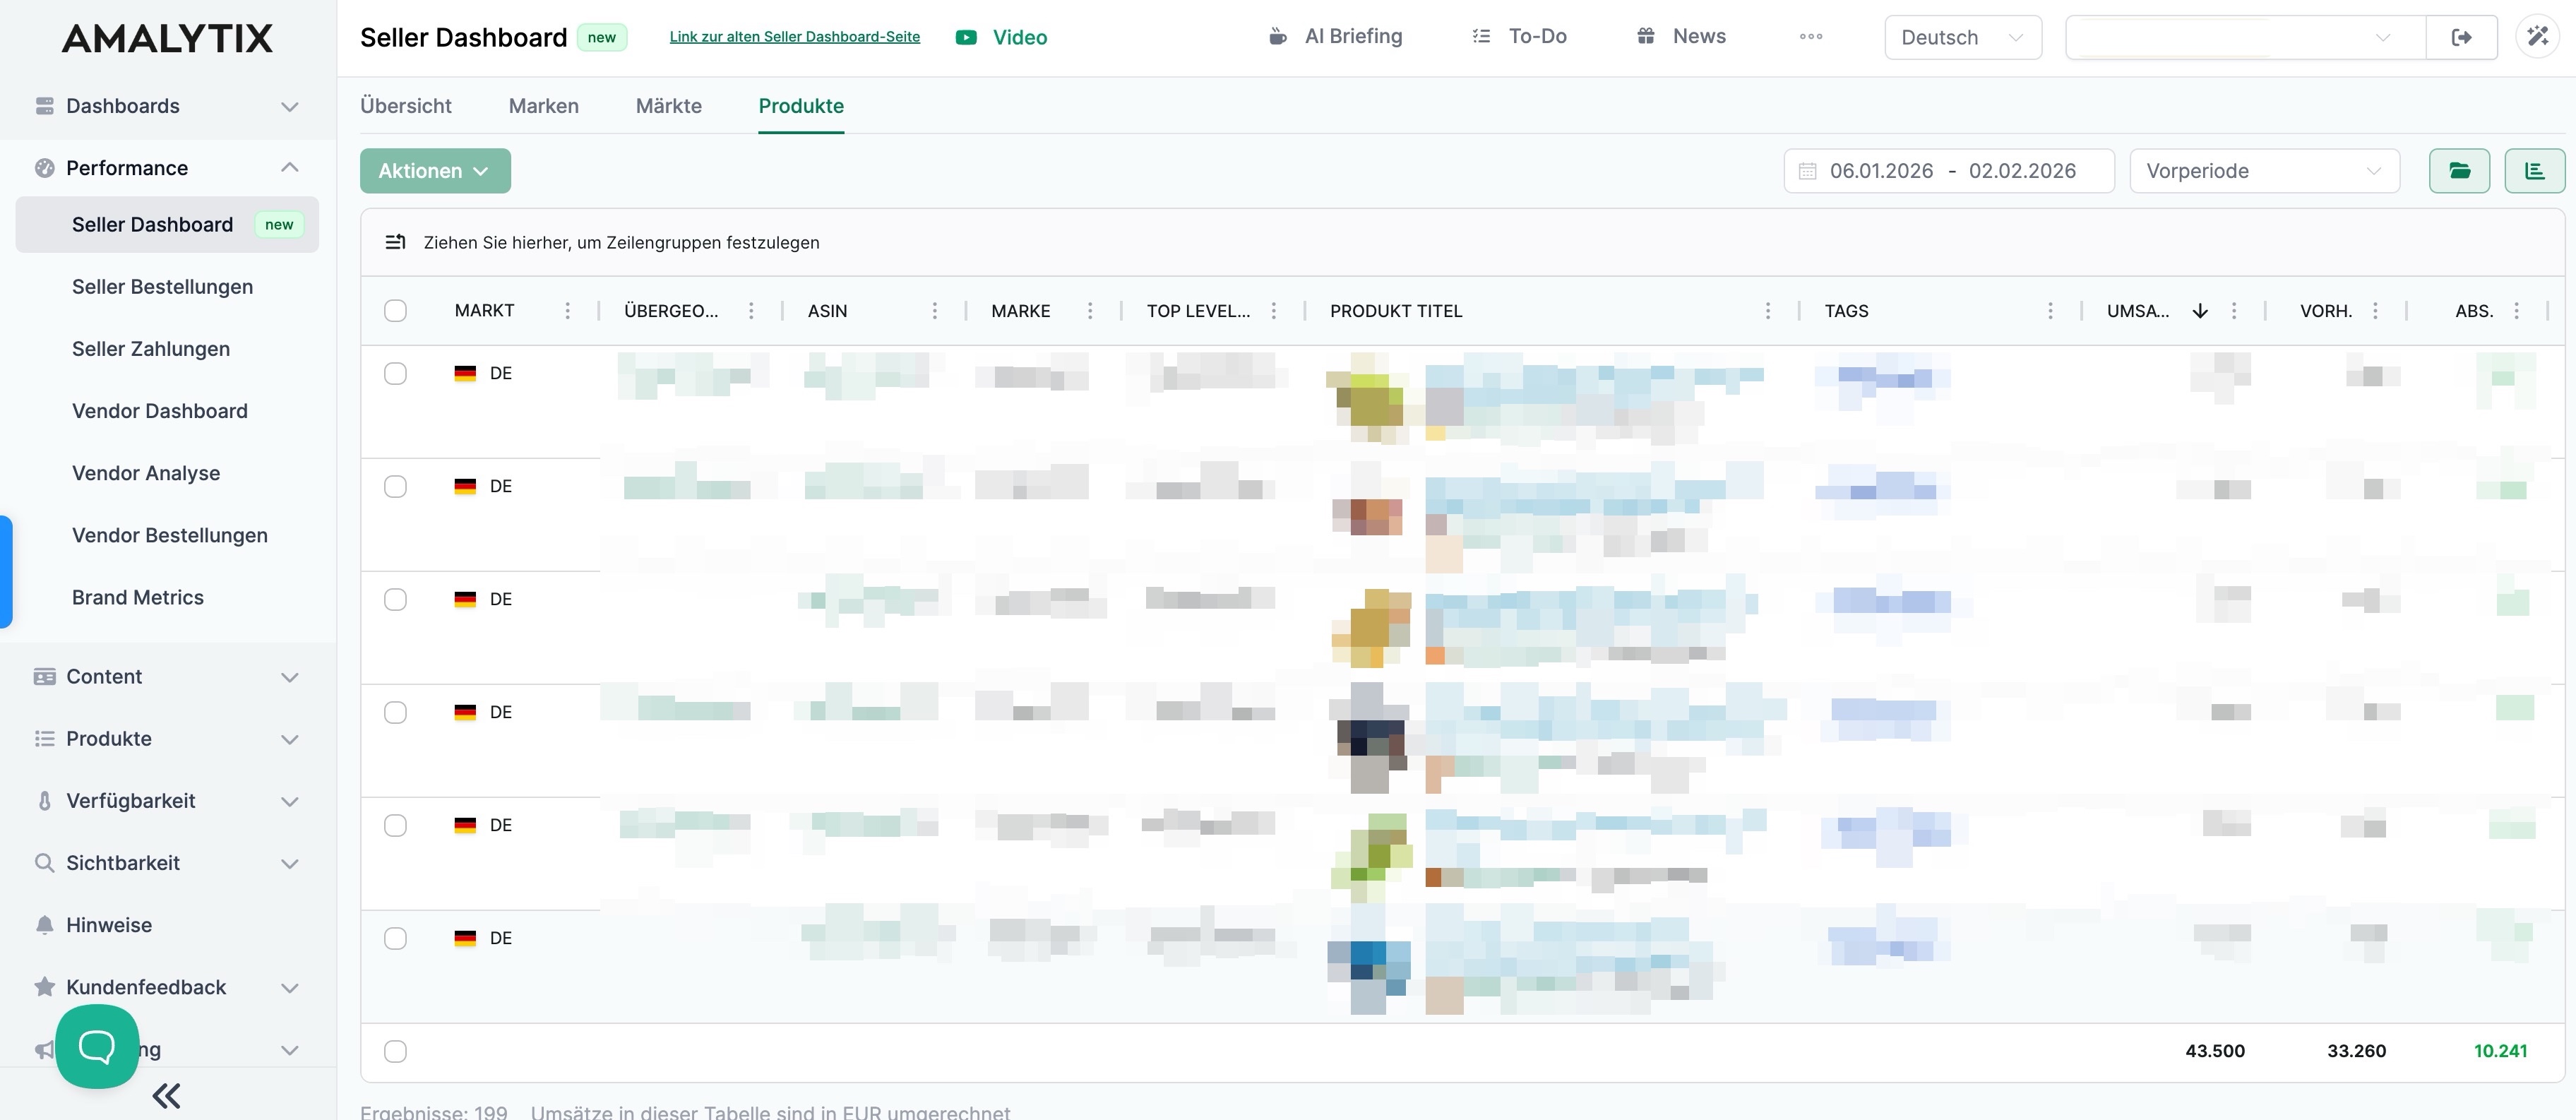
The table shows for each product:
| Column | Description |
|---|---|
| Market | Amazon marketplace |
| Parent ASIN | Parent ASIN for variants |
| ASIN | Product identifier |
| Brand | Associated brand |
| Top Level Category | Main category on Amazon |
| Product Title | Product name |
| Tags | Your product tags |
| Revenue | Current, previous period, absolute and percentage difference |
| Units | Current, previous period, absolute and percentage difference |
| Sessions | Current, previous period, absolute difference |
Tips for product analysis:
- Sort by revenue to find top sellers
- Filter by negative change to identify problem products
- Use the search function for targeted analysis
Saving Filters
You can save your filter settings to quickly recall frequently used views:
- Set your desired filters
- Click on Filter
- Enter a name and save
- Select saved filters via the dropdown menu
Related Features
- Seller Orders: Detailed view of individual orders
- Seller Payments: Analysis of your Amazon payments and fees
- Reports: Export your data as a report