Amazon Analysis for Vendors
The following video gives you a good overview:
What is Vendor Analysis?
The Vendor Analysis helps you understand the performance of your products on Amazon. You can compare different metrics over time to identify trends and spot winners and losers in your product portfolio.
With this module you can answer questions like:
- Which products had the highest sales increases or decreases this month compared to the previous month?
- Which brands generated a higher or lower contribution margin this month compared to the same month last year?
- Which marketplaces have gained or lost the most in relative terms this year?
The Two Sections
The Vendor Analysis is divided into two tabs:
Overview
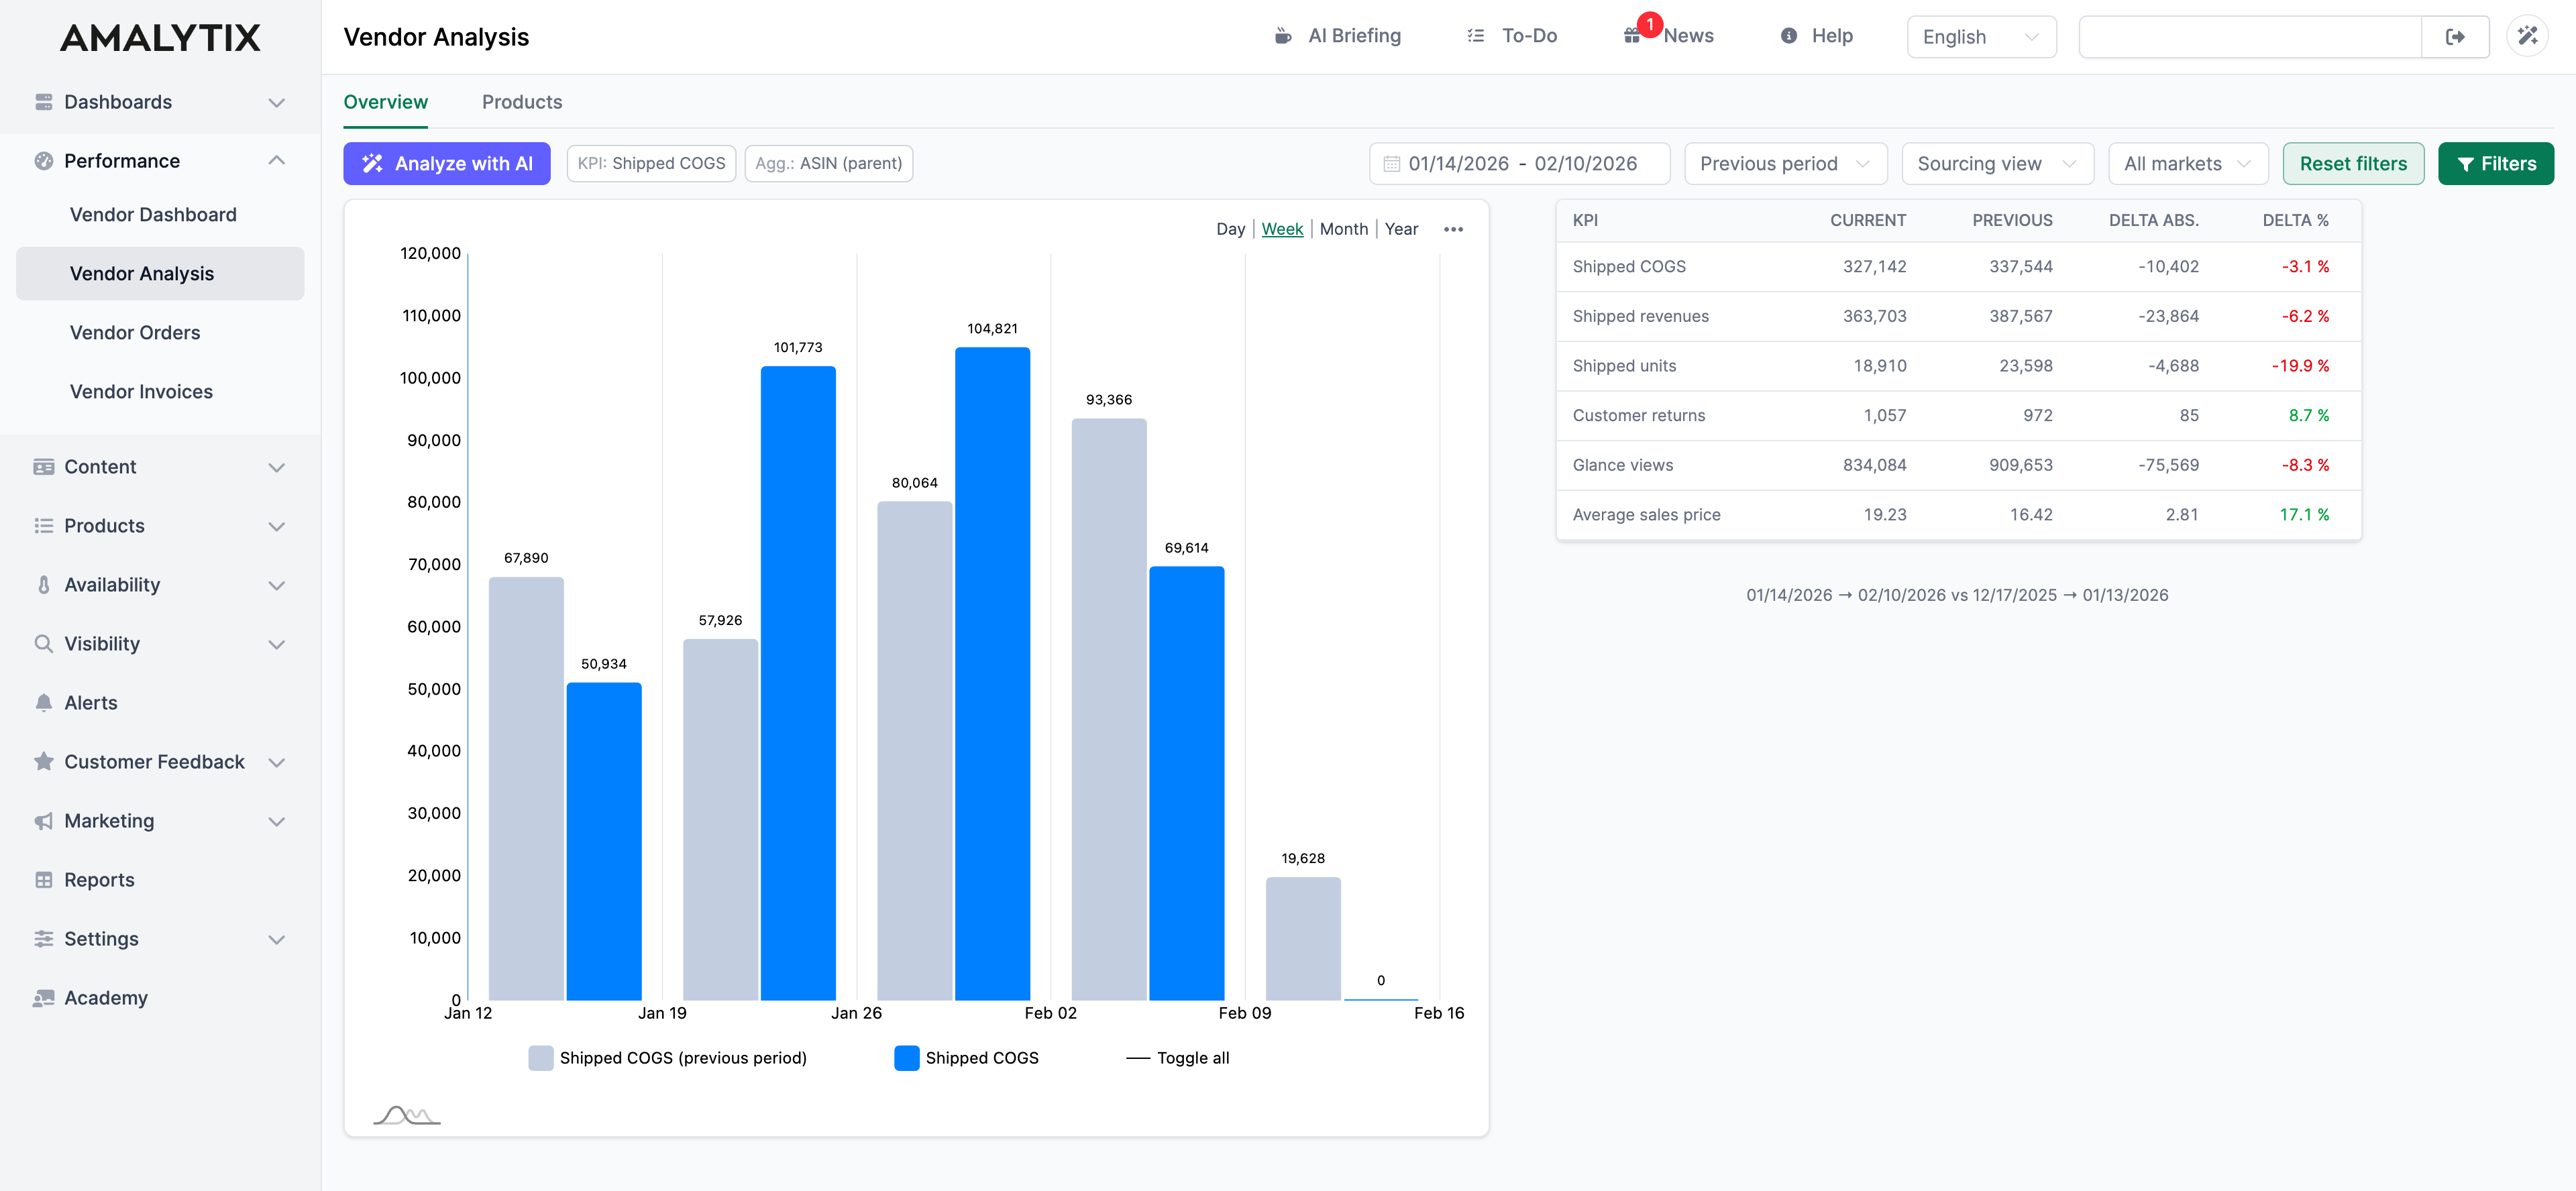
In the Overview tab, you can see all important metrics at a glance. The available metrics depend on the selected view:
Sourcing View
- Shipped COGS: The cost of goods sold incurred by Amazon when purchasing items from you
- Shipped Revenue: The revenue Amazon generates with your products (based on the selling price to customers)
- Shipped Units: The number of product units shipped to customers
- Customer Returns: The number of units returned by customers
- Glance Views: How often customers viewed your product pages
- Average Sales Price: The average price at which your products were sold
Manufacturing View
- Ordered Revenue: The ordered product sales in a selected period
- Ordered Units: The number of units ordered by Amazon
The chart shows the time progression of the selected metric. You can switch the view to days, weeks, months, or years.
The table shows for each metric:
- The current value for the selected period
- The value of the comparison period (previous period or previous year)
- The absolute difference between both values (Delta abs.)
- The percentage change (Delta %)
Products
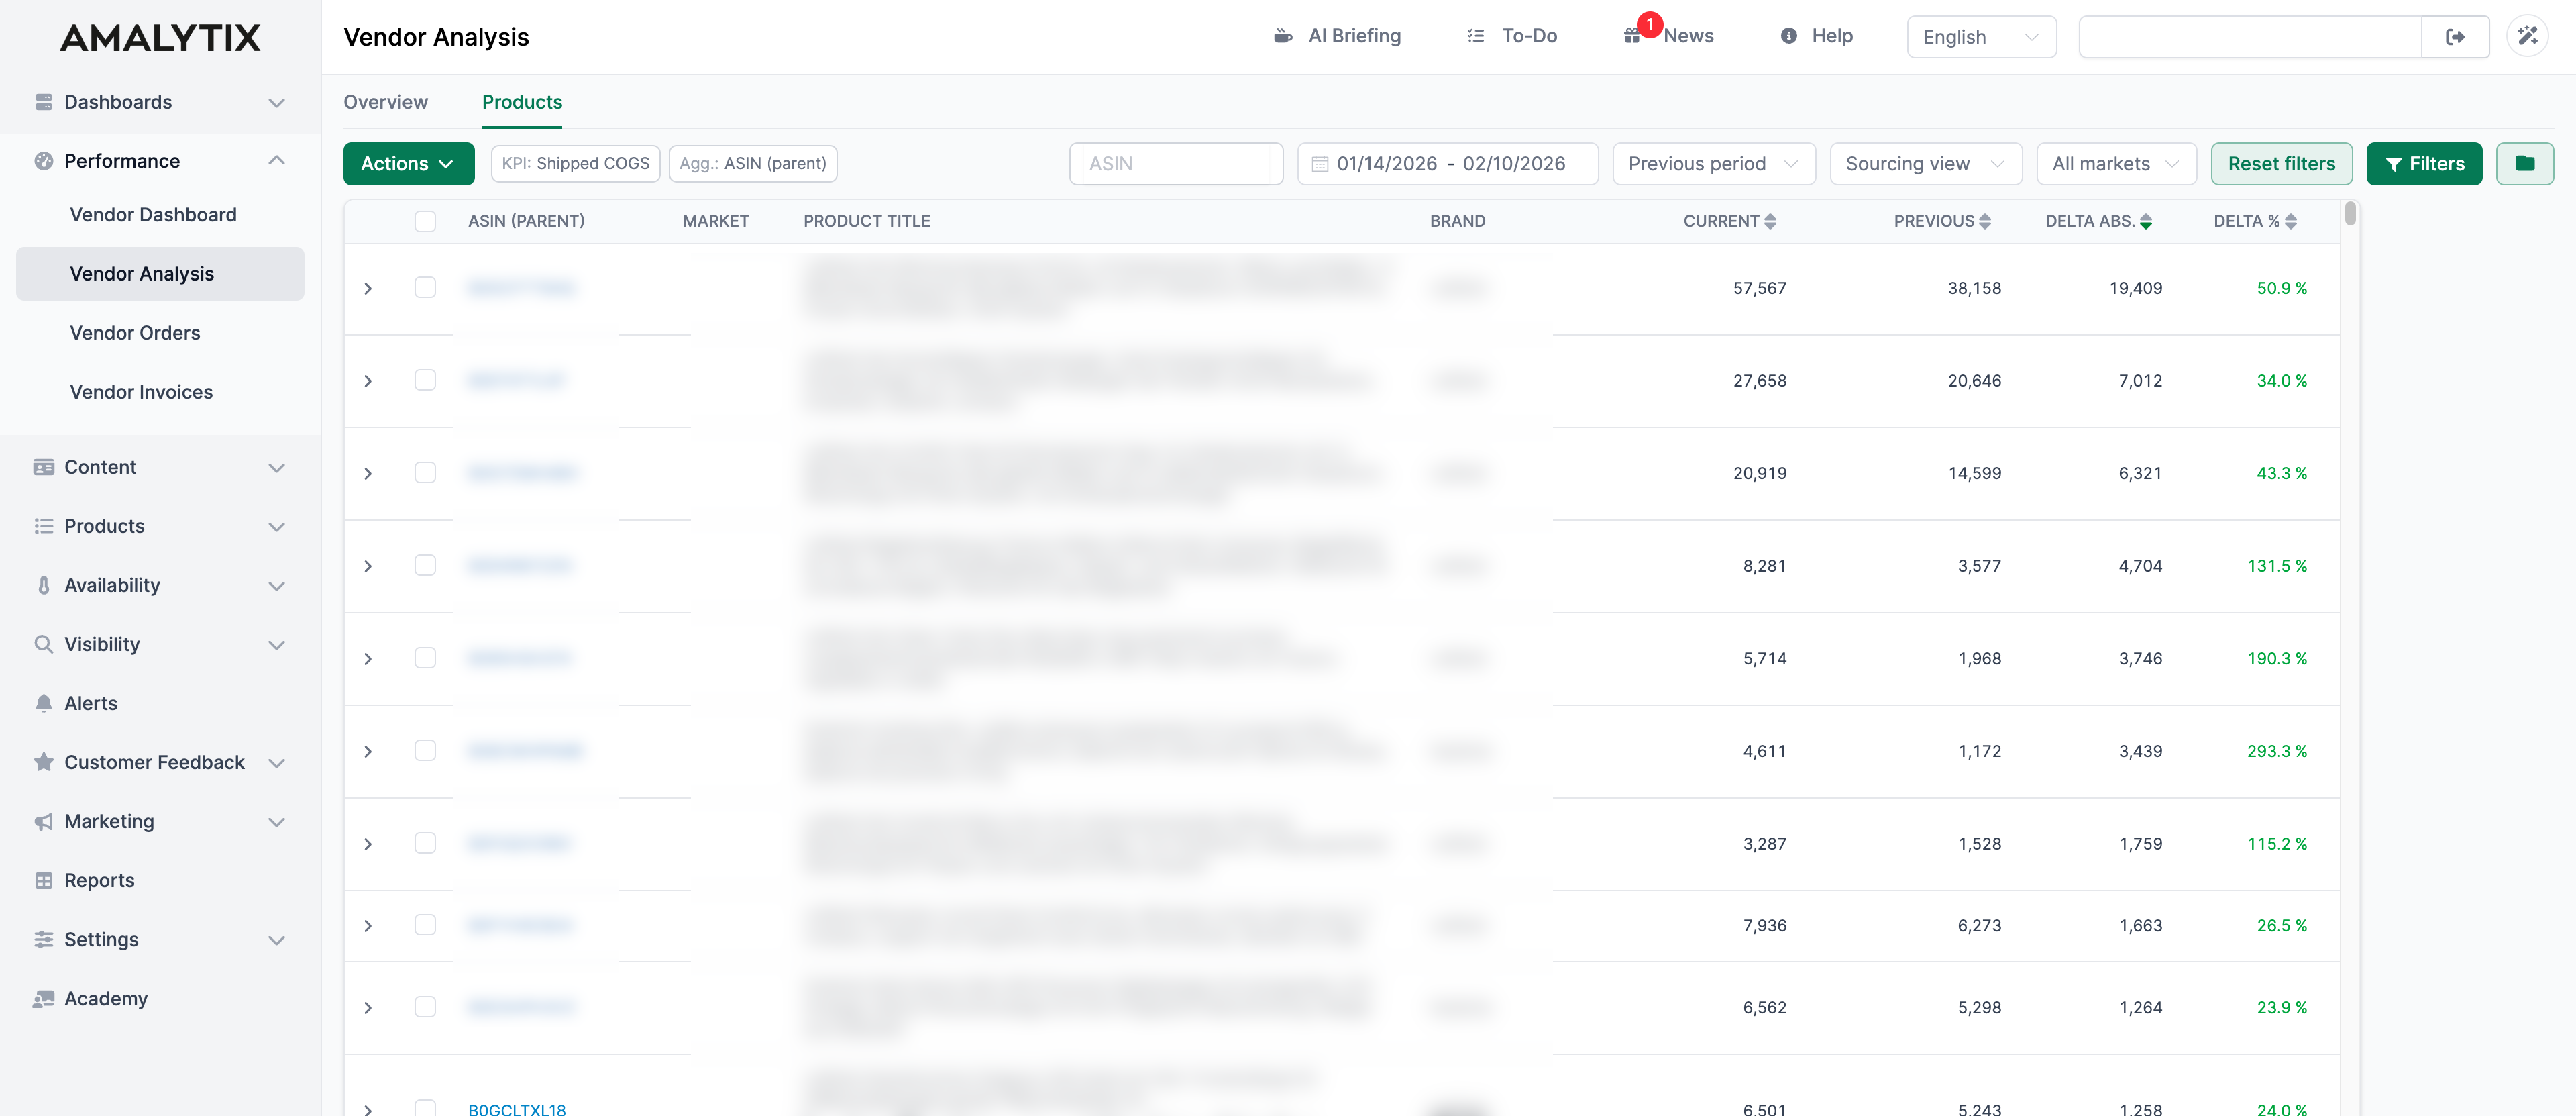
The Products tab provides a detailed breakdown by different aggregation levels:
- ASIN (child): Individual product variants
- ASIN (parent): Product families
- Brand: All products of a brand combined
- Category: Products grouped by Amazon category
- Market: Performance per marketplace
The table shows for each row:
- ASIN / Brand / Category / Marketplace: Depending on the selected aggregation level
- Market: The marketplace
- Product Name: The product title
- Brand: The brand name
- Current: The value of the current period for the selected metric
- Previous Period: The value of the comparison period
- Delta abs.: The absolute difference between both periods
- Delta %: The percentage change
Click on the arrow on the left in a row to drill down into the data. For example, you can see the child ASINs of a parent ASIN or the individual products of a brand.
Filter Settings
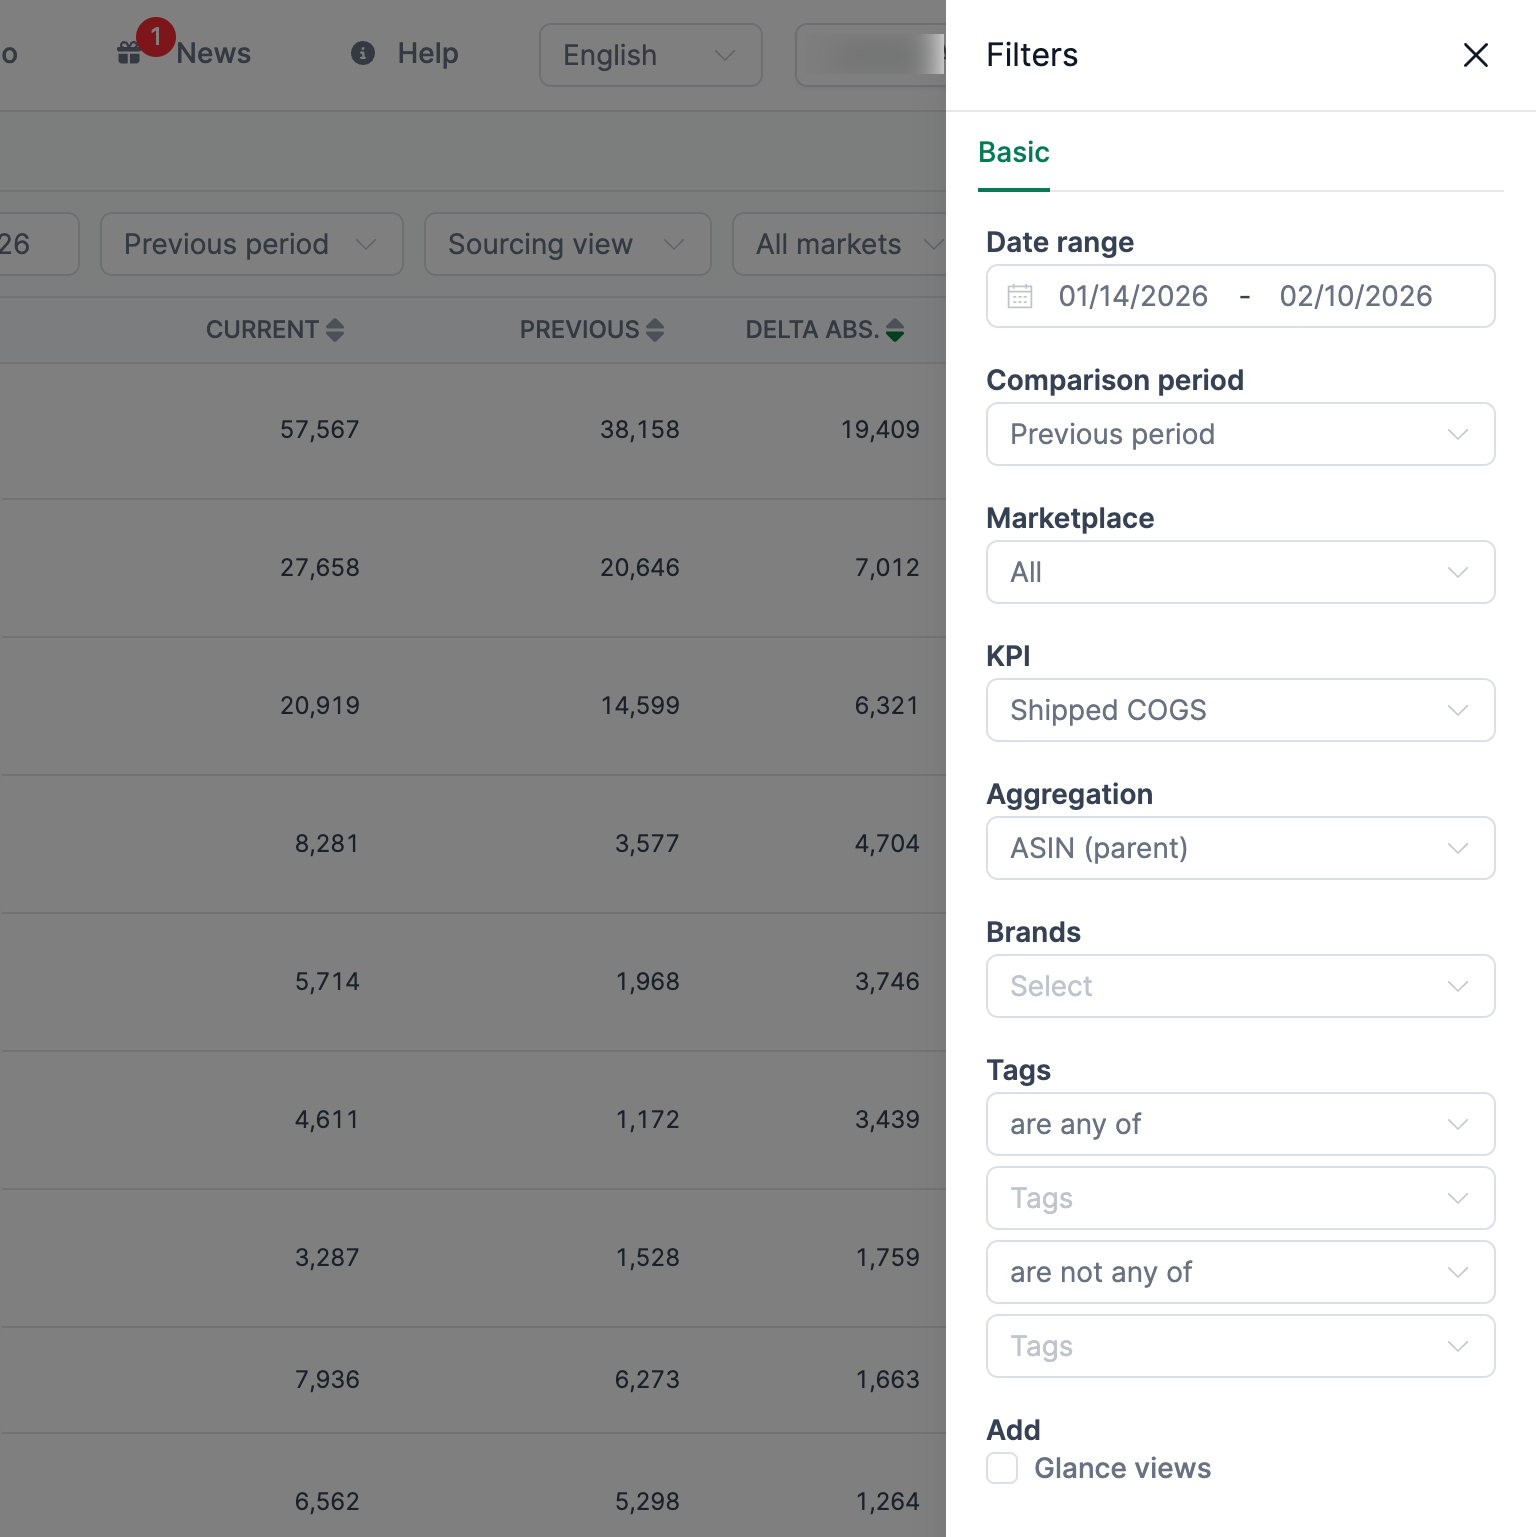
To use the module effectively, set the following filters:
-
Date Range: Select the time period you want to analyze. By default, the last 28 days are set. You can also compare, for example, October of this year with October of last year.
-
Comparison Period: Choose what to compare against:
- Previous Period: Comparison with the same length period immediately before
- Last Year: Comparison with the same period last year
-
View: Choose between:
- Sourcing View: Shows metrics like Shipped COGS, shipped units, and revenue
- Manufacturing View: Shows ordered revenue and ordered units
-
Market: Filter by a specific marketplace or view all markets
-
KPI: Select the metric you want to analyze (e.g., Shipped COGS, Shipped Revenue, etc.)
-
Aggregation: Choose how the data should be grouped (by ASIN, Brand, Category, or Market)
-
Brands: Filter by specific brands
-
Tags: Filter by your own product tags
Analyze with AI
Click the Analyze with AI button to have our AI automatically evaluate your sales data. The AI creates a summary of the most important trends and notable findings for you.
Save Filters
You can save your filter settings to quickly recall them later. Use the “Select saved filter” dropdown to select an existing filter or create a new one.
Export Data
In the Products tab, you can download the displayed data as an Excel file. Click the Download Excel List button to export.
Sourcing View vs. Manufacturing View
AMALYTIX offers two different views for your vendor data:
Sourcing View This view shows what was actually shipped to customers. The numbers are based on shipping data and show the real flow of goods.
Manufacturing View This view shows the orders Amazon placed with you. These numbers are particularly relevant for production planning.
Depending on your analysis purpose, one of the two views is better suited:
- For revenue analysis, the Sourcing View is usually more appropriate
- For production planning, the Manufacturing View is more useful
Related Pages
- Vendor Dashboard - Daily performance overview
- Vendor Orders - View Amazon orders
- Reports - Export data