Digital Shelf
The Digital Shelf module helps Amazon Vendors and Sellers understand their brand presence and performance compared to competitors. Use it to analyze specific niches and make data-driven decisions to improve your visibility on Amazon.
Discover how to make the most of the Digital Shelf in this video:
Why Use Digital Shelf?
- Understand competition: See which brands and products dominate your niche
- Identify opportunities: Find gaps in the market and improvement potential for your listings
- Compare performance: Measure your visibility, pricing, and content quality against competitors
- Track trends: Monitor how product visibility changes over time
Core Features
- Market and niche analysis: Define niches using keywords or bestseller URLs and get an overview of dominant brands and products
- Product data analysis: Insights into pricing, Prime availability, advertising activities, image count, and estimated revenue
- Brand analysis: Aggregated data per brand including marketing activities, average LQI, promotions, and product count
- Time-based trends: Compare current data with results from one or four weeks ago
- Content analysis: Data on Listing Quality Index, product images, A+ Content, and Brand Stories
- Buy Box analysis: Identify which sellers dominate the Buy Box and how prices are distributed
- Sales estimates: Estimated revenue based on sales data and pricing
Creating a New Analysis
To analyze a niche, click on Create new analysis.
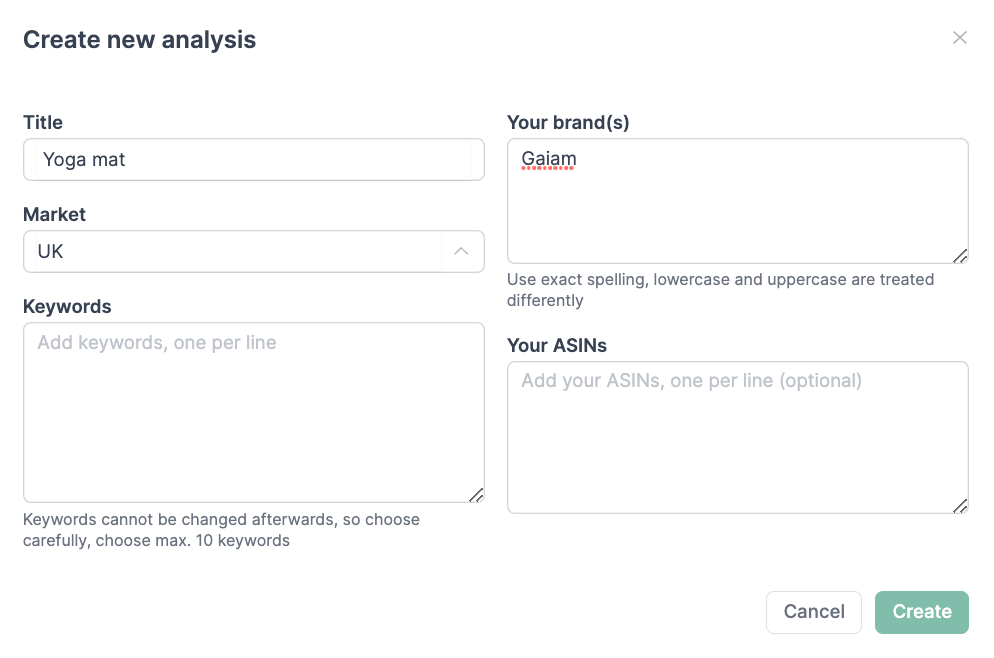
In the pop-up window, enter the following information:
-
Title: A descriptive name for your analysis
-
Marketplace: The Amazon marketplace you want to analyze
-
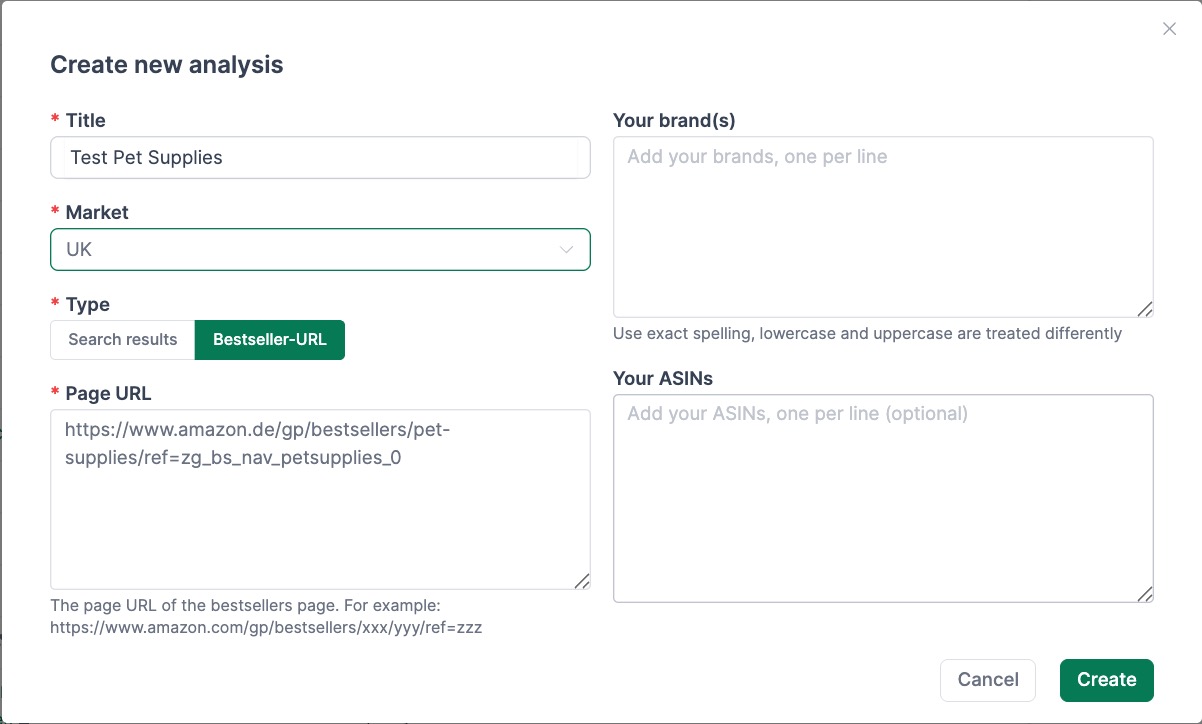
Analysis type: Choose between:
- Keywords: Analyze search results for up to 5 keywords
- Bestseller URL: Examine an entire bestseller category
-
Brands (optional): Enter your own brand names to highlight them in the results
-
ASINs (optional): Add specific products you want to track
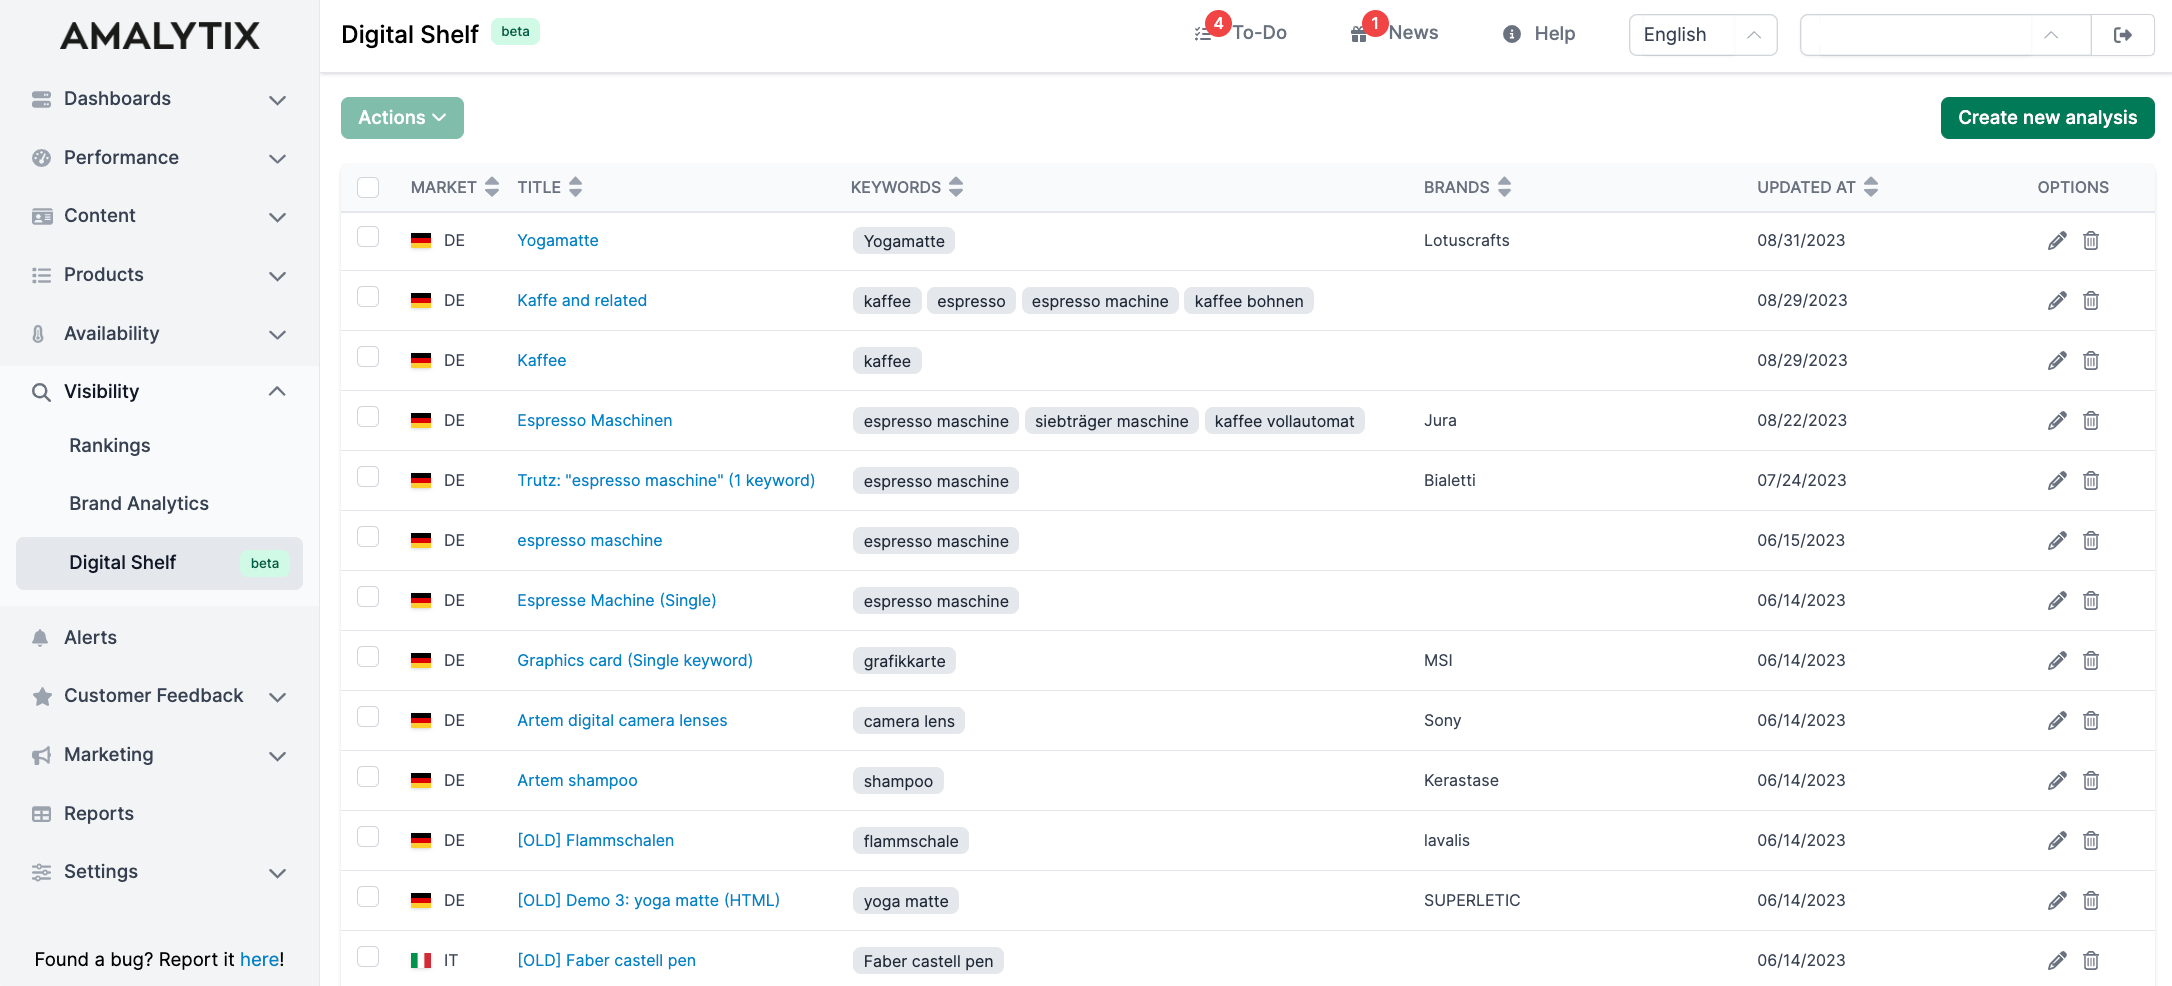
The Analysis Overview
The main page displays all your created analyses in a table with the following columns:
- Market: The Amazon marketplace
- Title: Name of the analysis (clickable, leads to detail view)
- URL: The keywords used or the bestseller URL
- Brands: Your specified brand names
- Updated at: Time of the last data refresh
- Options: Edit or delete the analysis
Click on the Title of an analysis to view detailed results.
Analysis Detail View
After clicking on an analysis, you will see the detail view with five tabs:
Brands
Here you see an overview of all brands in the niche with aggregated metrics.
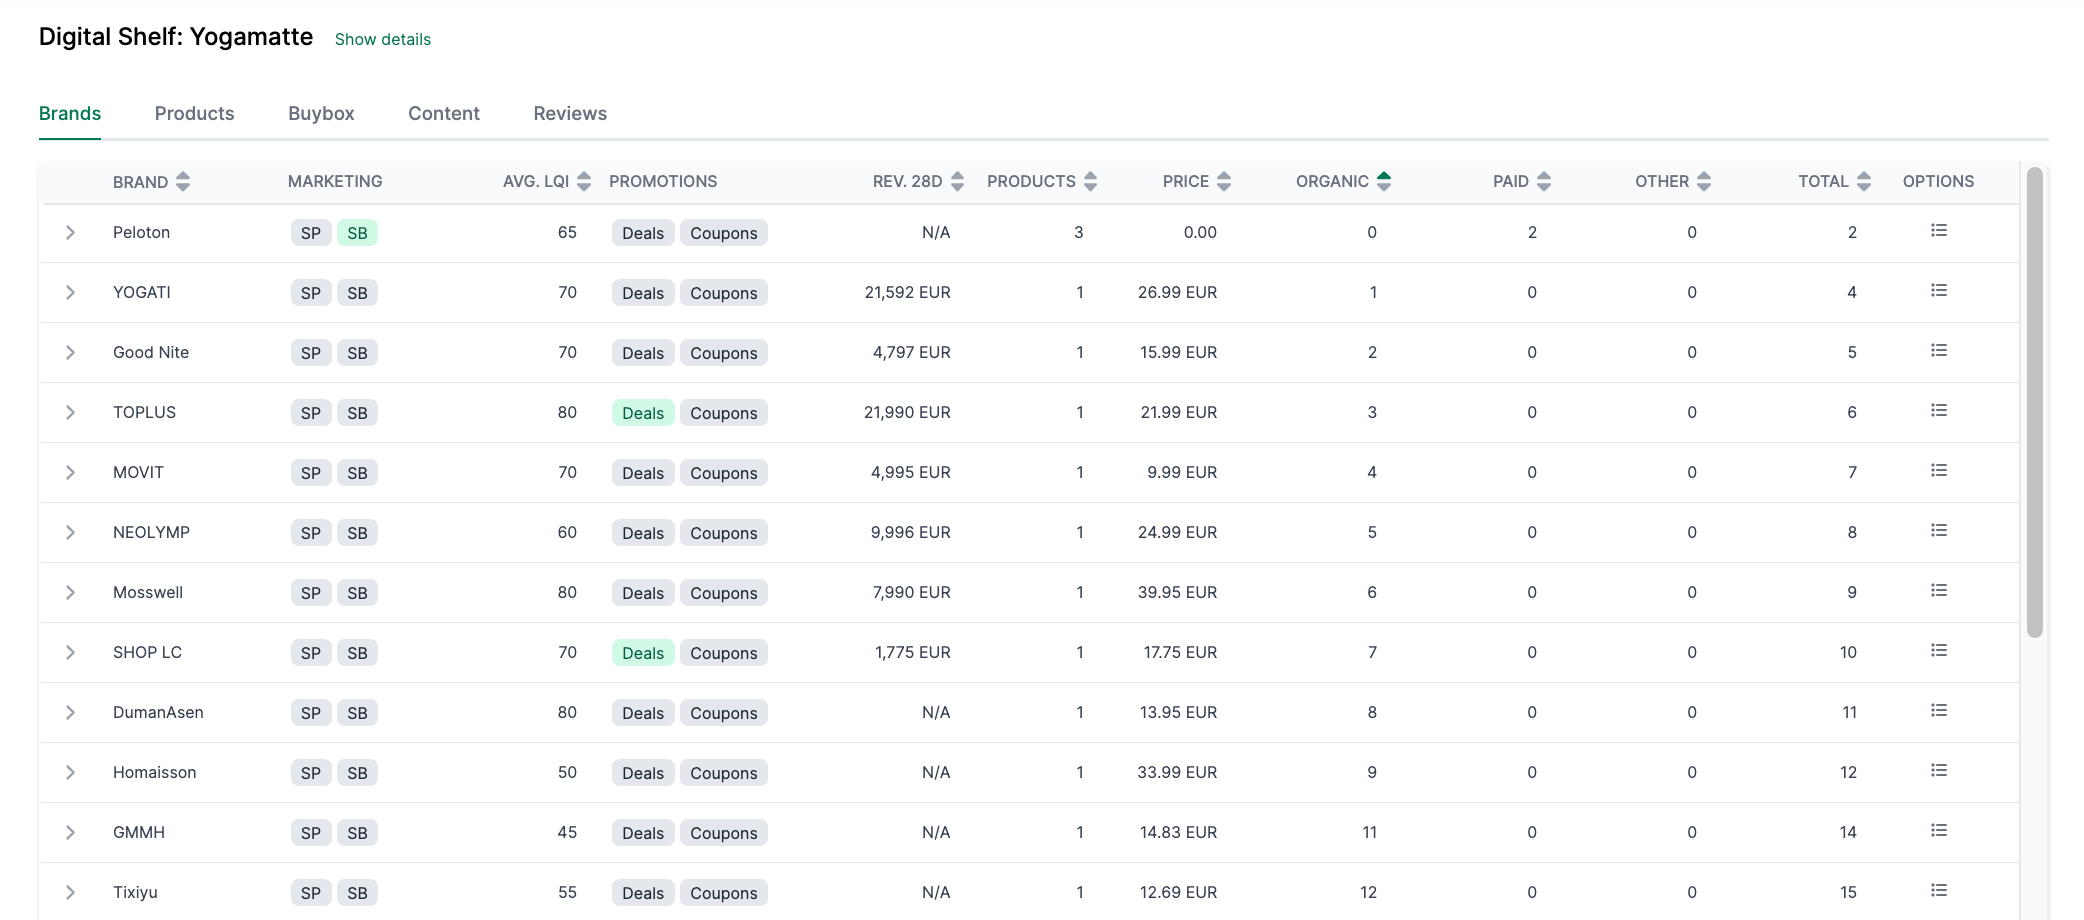
Available columns:
| Column | Description |
|---|---|
| Brand | Brand name |
| Marketing | Shows active Sponsored Products or Sponsored Brands campaigns |
| LQI | Average Listing Quality Index |
| Promotions | Active deals or coupons |
| Revenue 28d | Estimated revenue for the last 28 days |
| Products | Number of products from this brand in the niche |
| Price | Average product price |
| Pos. org. | Average organic position |
| Pos. Adv. | Average position in paid results |
| Pos. other | Average position in other placements |
| Total | Total number of placements |
Click on Options to jump directly to a brand’s products.
Products
Here you see all products in the niche with detailed individual data.
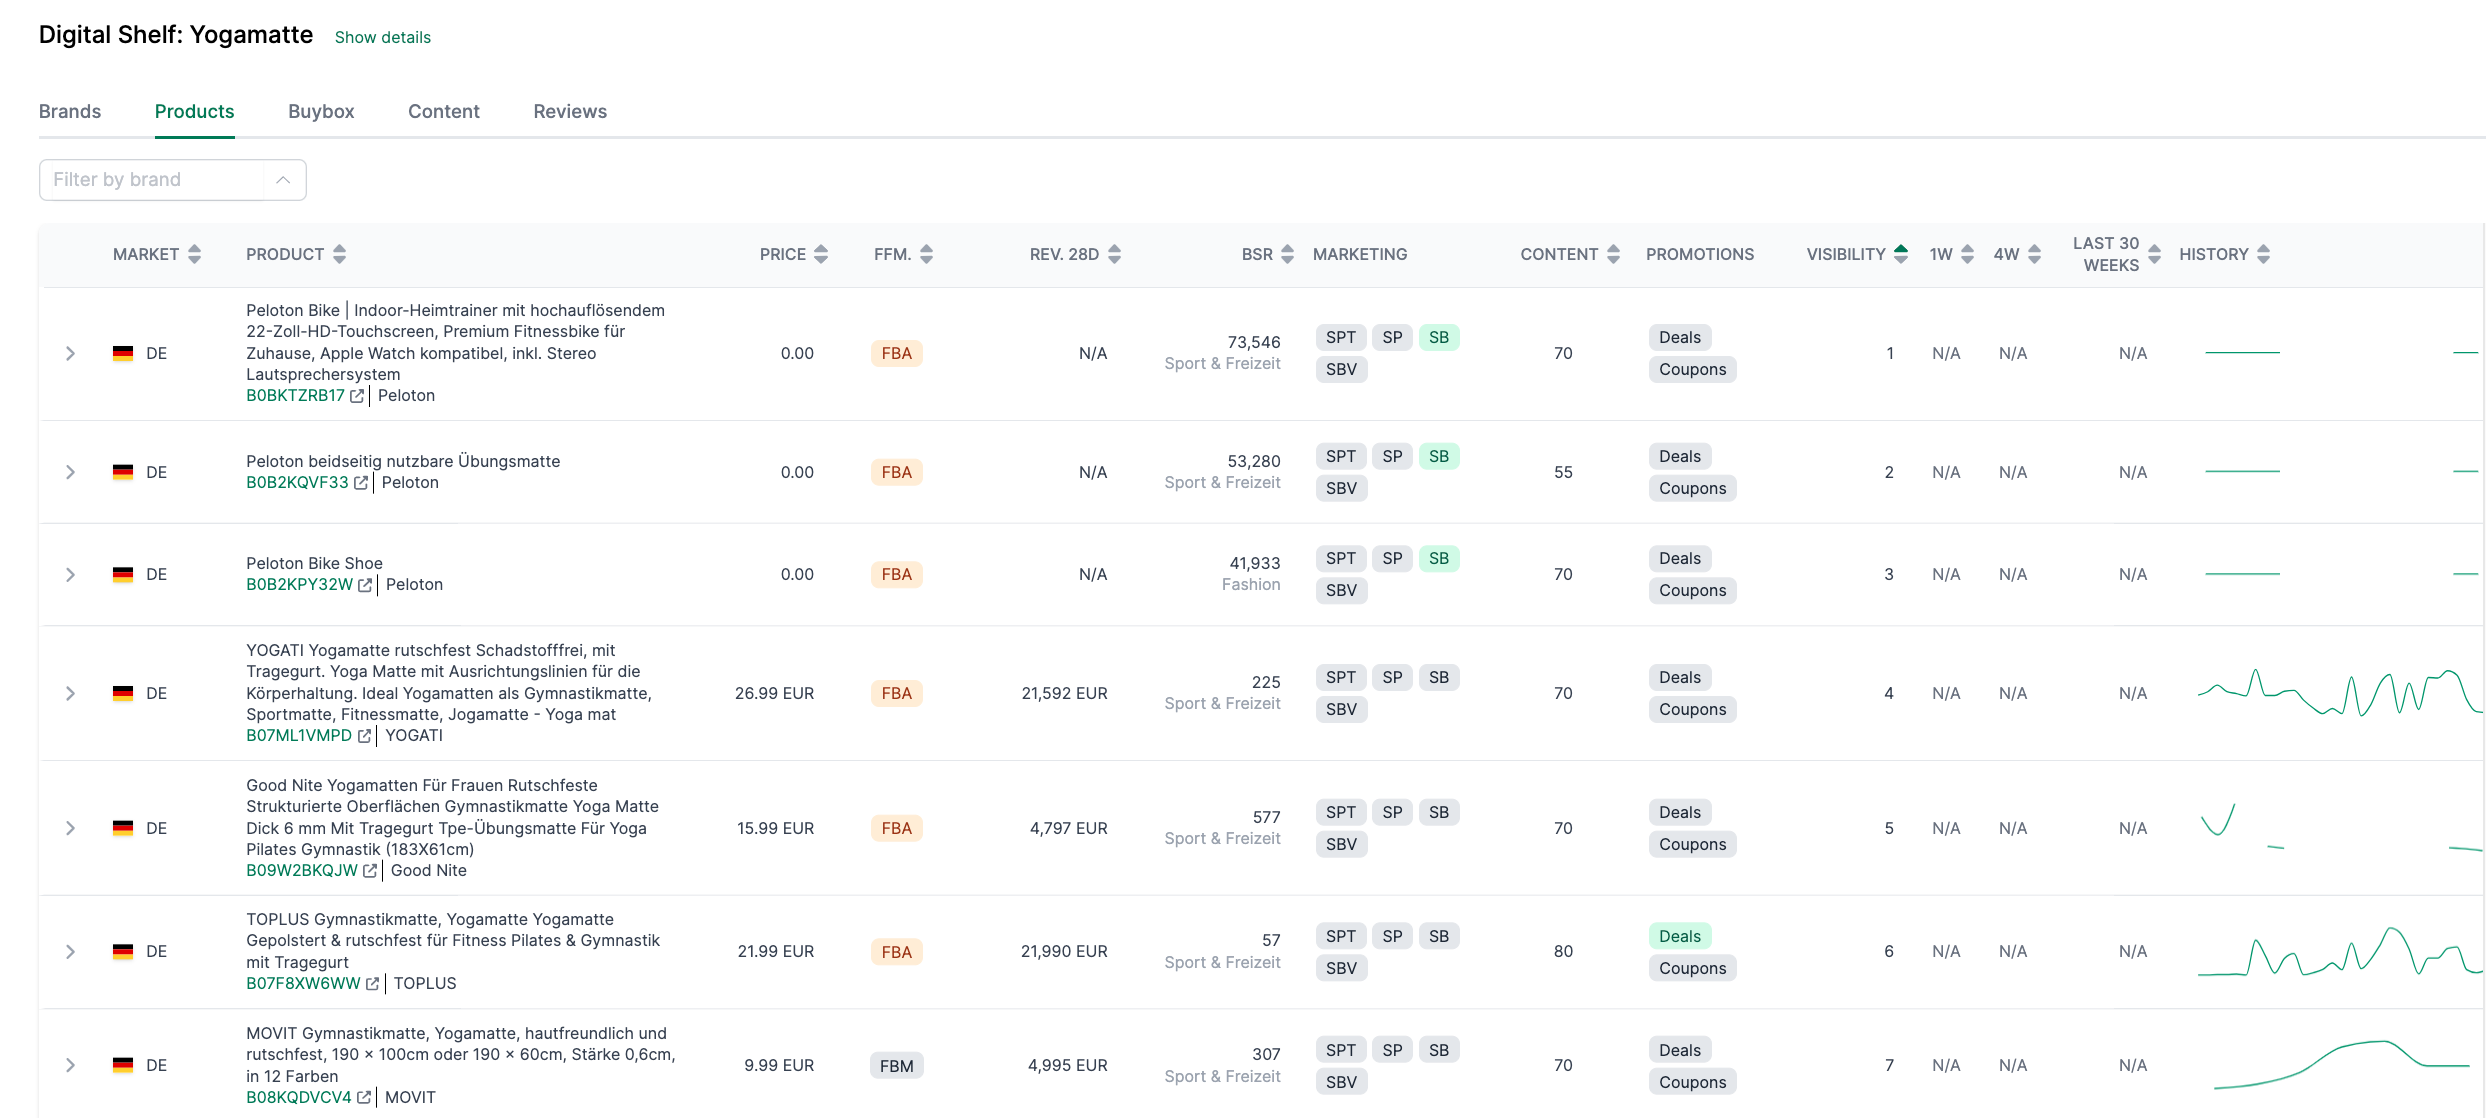
Available columns:
| Column | Description |
|---|---|
| Market | Amazon marketplace |
| Product | Product image, title, ASIN, and brand |
| Price | Current selling price |
| Ffm. | Fulfillment method (FBA, FBM, or Amazon) |
| Revenue 28d | Estimated revenue for the last 28 days |
| BSR | Bestseller Rank in the Amazon category |
| Marketing | Active advertising campaigns |
| Content | Listing Quality Index |
| Promotions | Active deals or coupons |
| Visibility | Current position in search results |
| 1w | Position one week ago |
| 4w | Position four weeks ago |
| Last 30 weeks | Average position over the last 30 weeks |
| History | Visual chart of visibility over time |
Filter: Use the “Filter by brand” dropdown to show only products from a specific brand.
Currency: Use the dropdown to switch between marketplace currency and your account currency.
Buybox
Analyze who dominates the Buy Box in the niche.
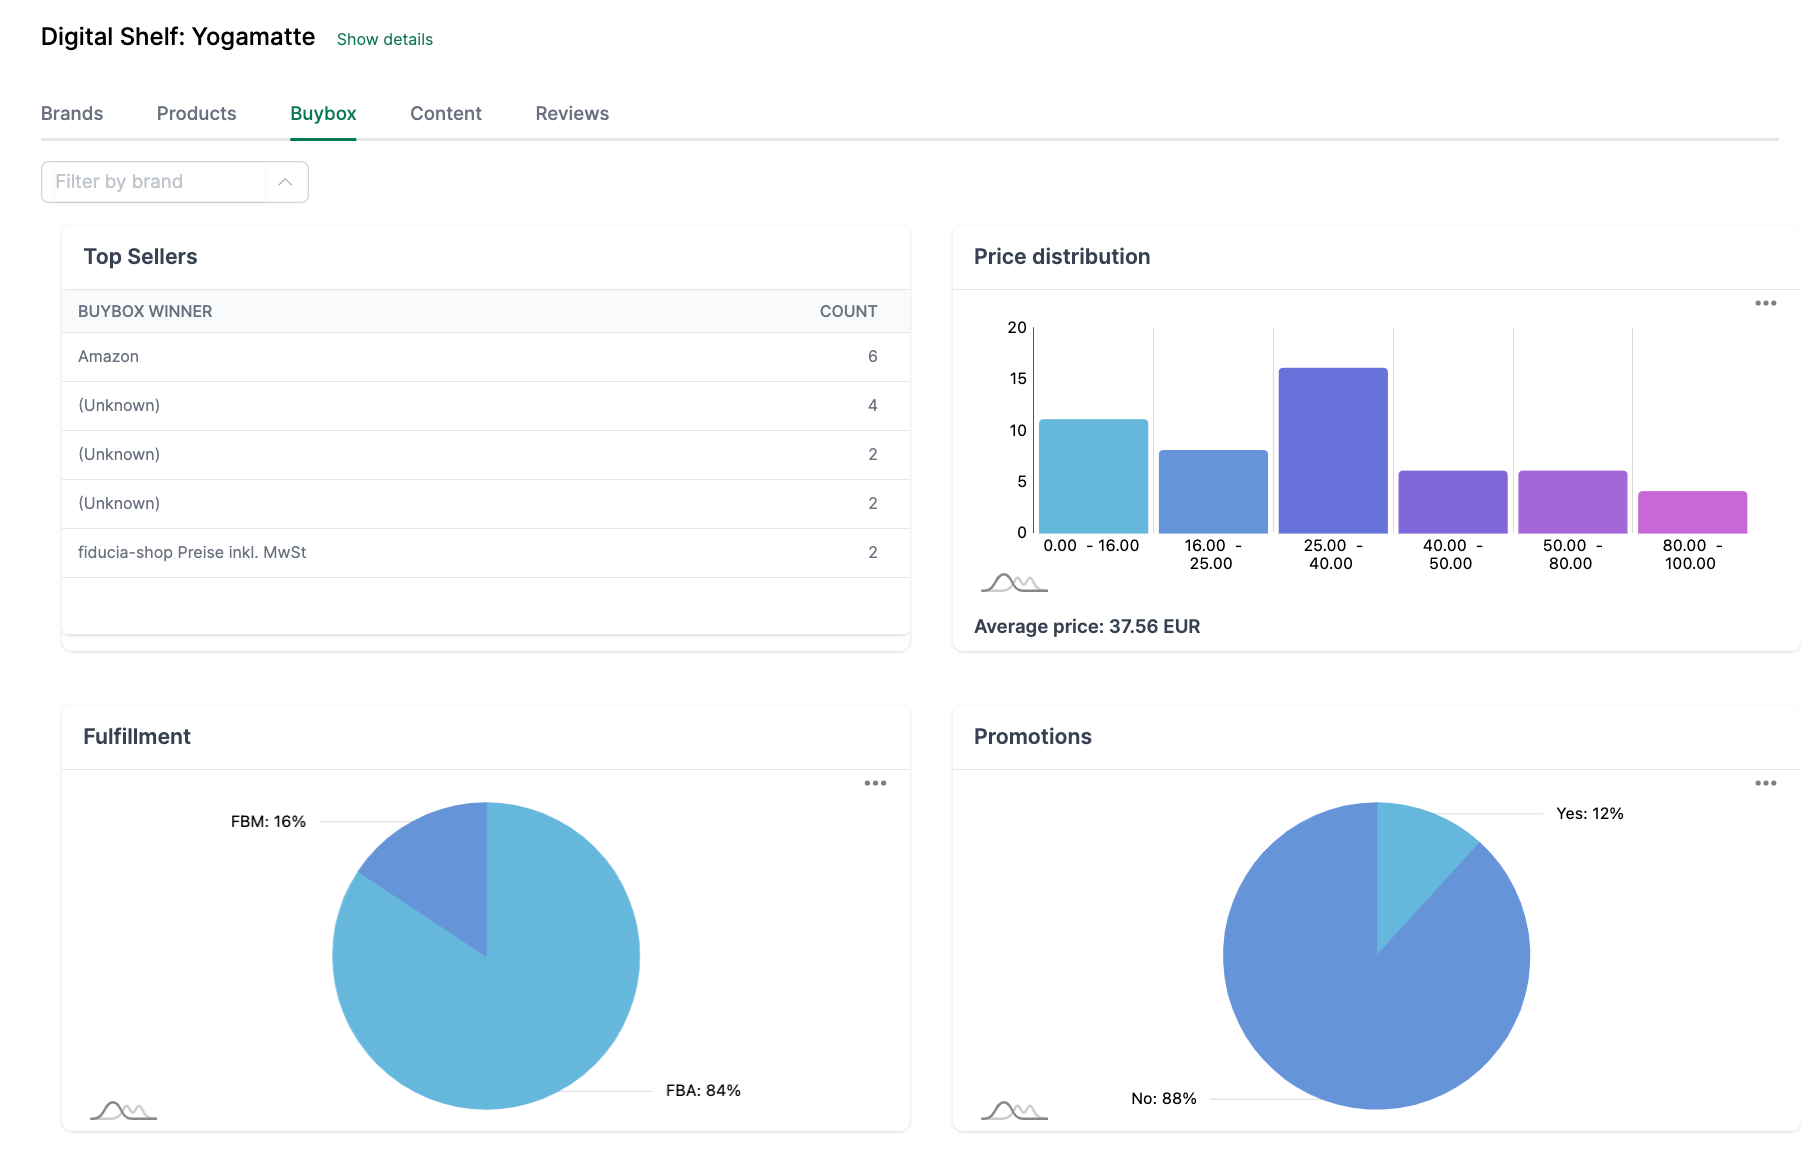
Available analyses:
- Top Sellers: List of the most frequent Buy Box winners
- Price distribution: Distribution of prices and average price
- Fulfillment: Share of FBA, FBM, and Amazon
- Promotions: Share of products with active promotions
Content
Compare content quality across the niche.
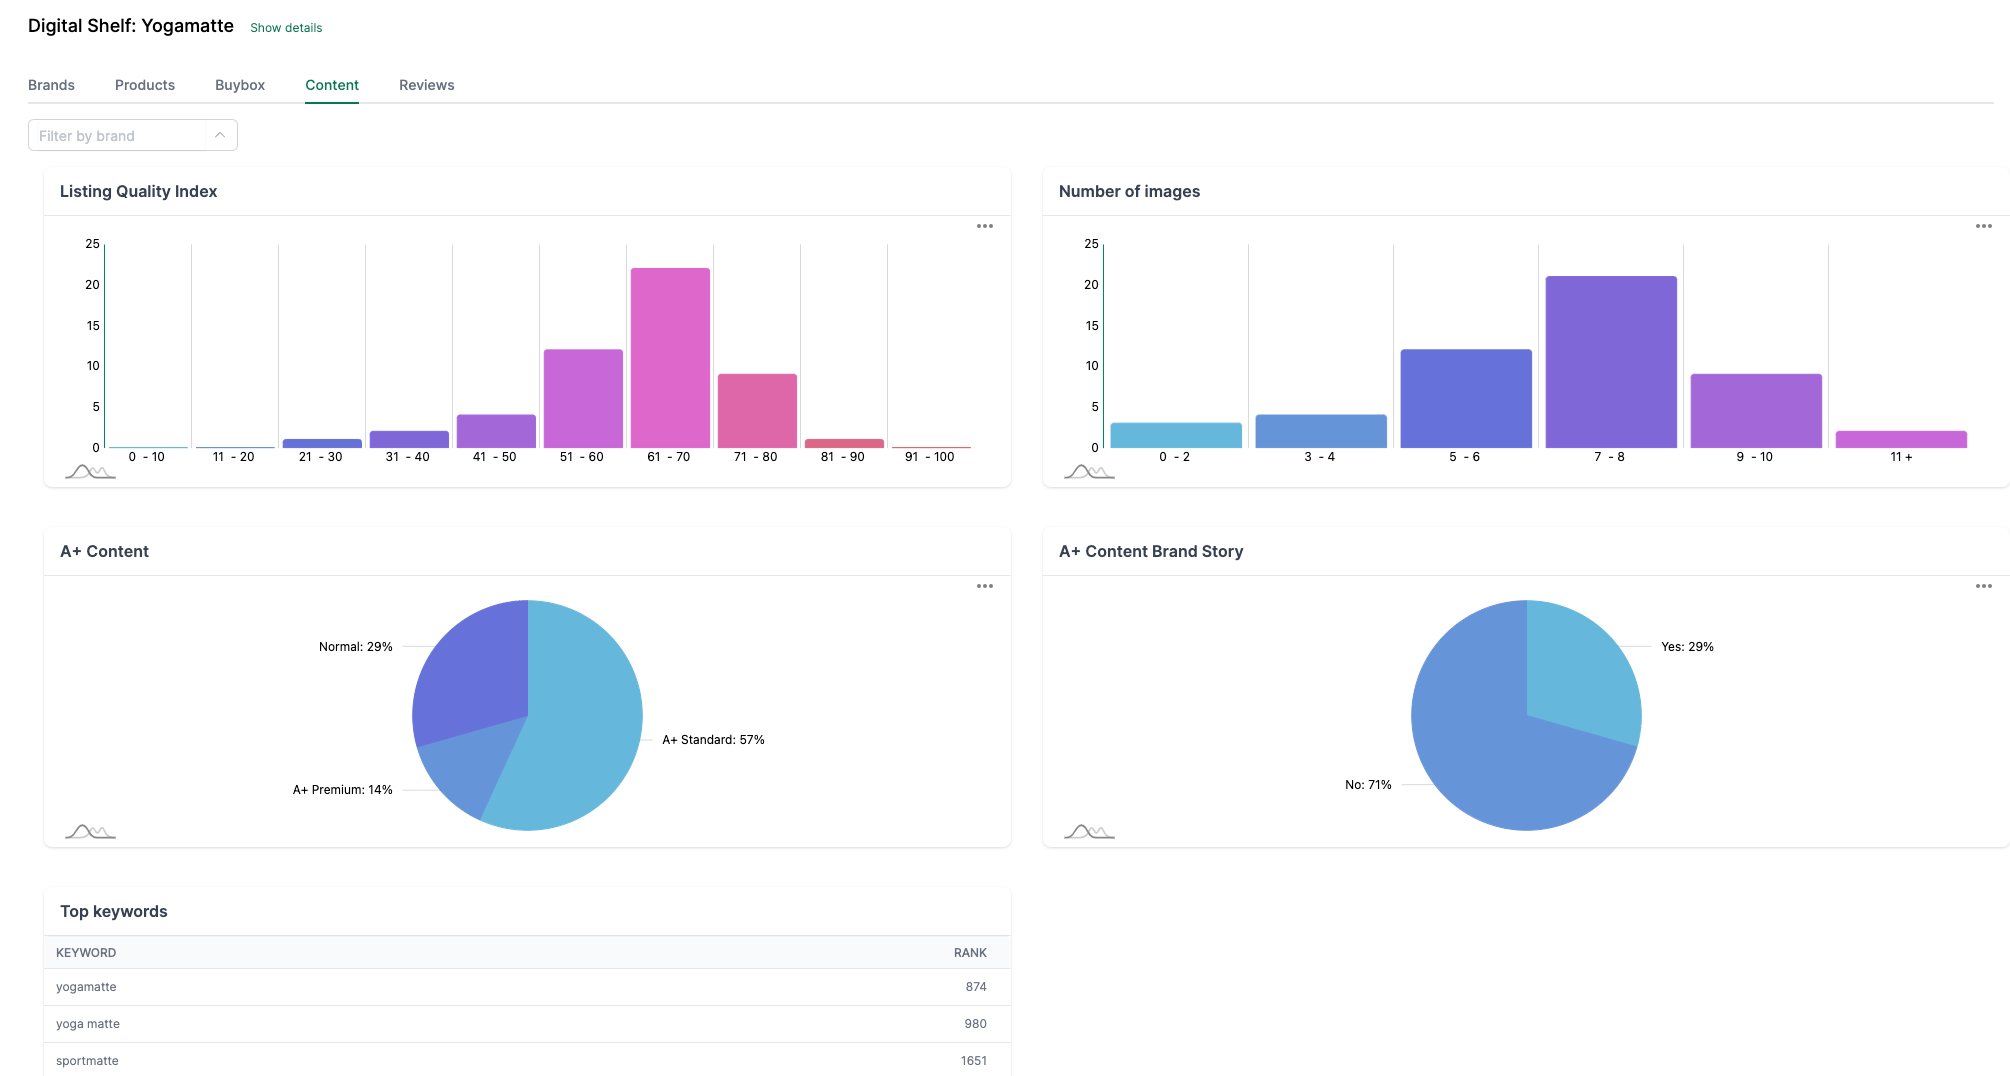
Available analyses:
- LQI distribution: Distribution of Listing Quality Index values
- Number of images: How many product images listings have
- A+ Content: Share of products with A+ Standard and Premium Content
- A+ Content Brand Story: Share of products with Brand Story
- Top keywords: The most important keywords with search frequency rank (from Brand Analytics)
Reviews
Analyze the review situation in the niche.
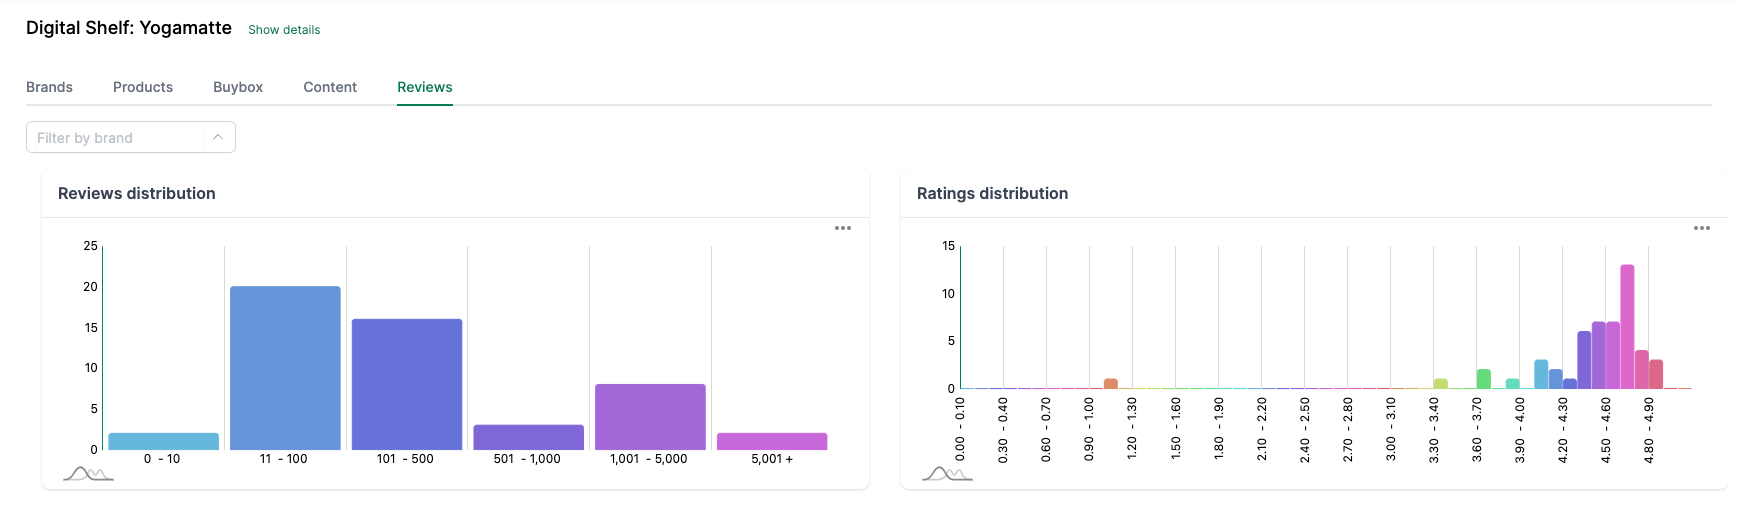
Available analyses:
- Reviews distribution: How many reviews products have
- Ratings distribution: Distribution of star ratings (e.g., 4.0-4.5 stars)
Tips for Usage
- Check regularly: Data is automatically updated. Check back regularly to identify trends.
- Add your brands: Enter your own brands to highlight them in the analysis.
- Combine keywords: Use multiple related keywords for a more comprehensive niche analysis.
- Use export: Download data as an Excel file for further analysis.