Analyze Amazon Search Query Performance
The Search Query Performance Report shows you how your products perform for specific search terms on Amazon. With AMALYTIX, you can analyze this data more easily and flexibly than in Seller Central.
Overview
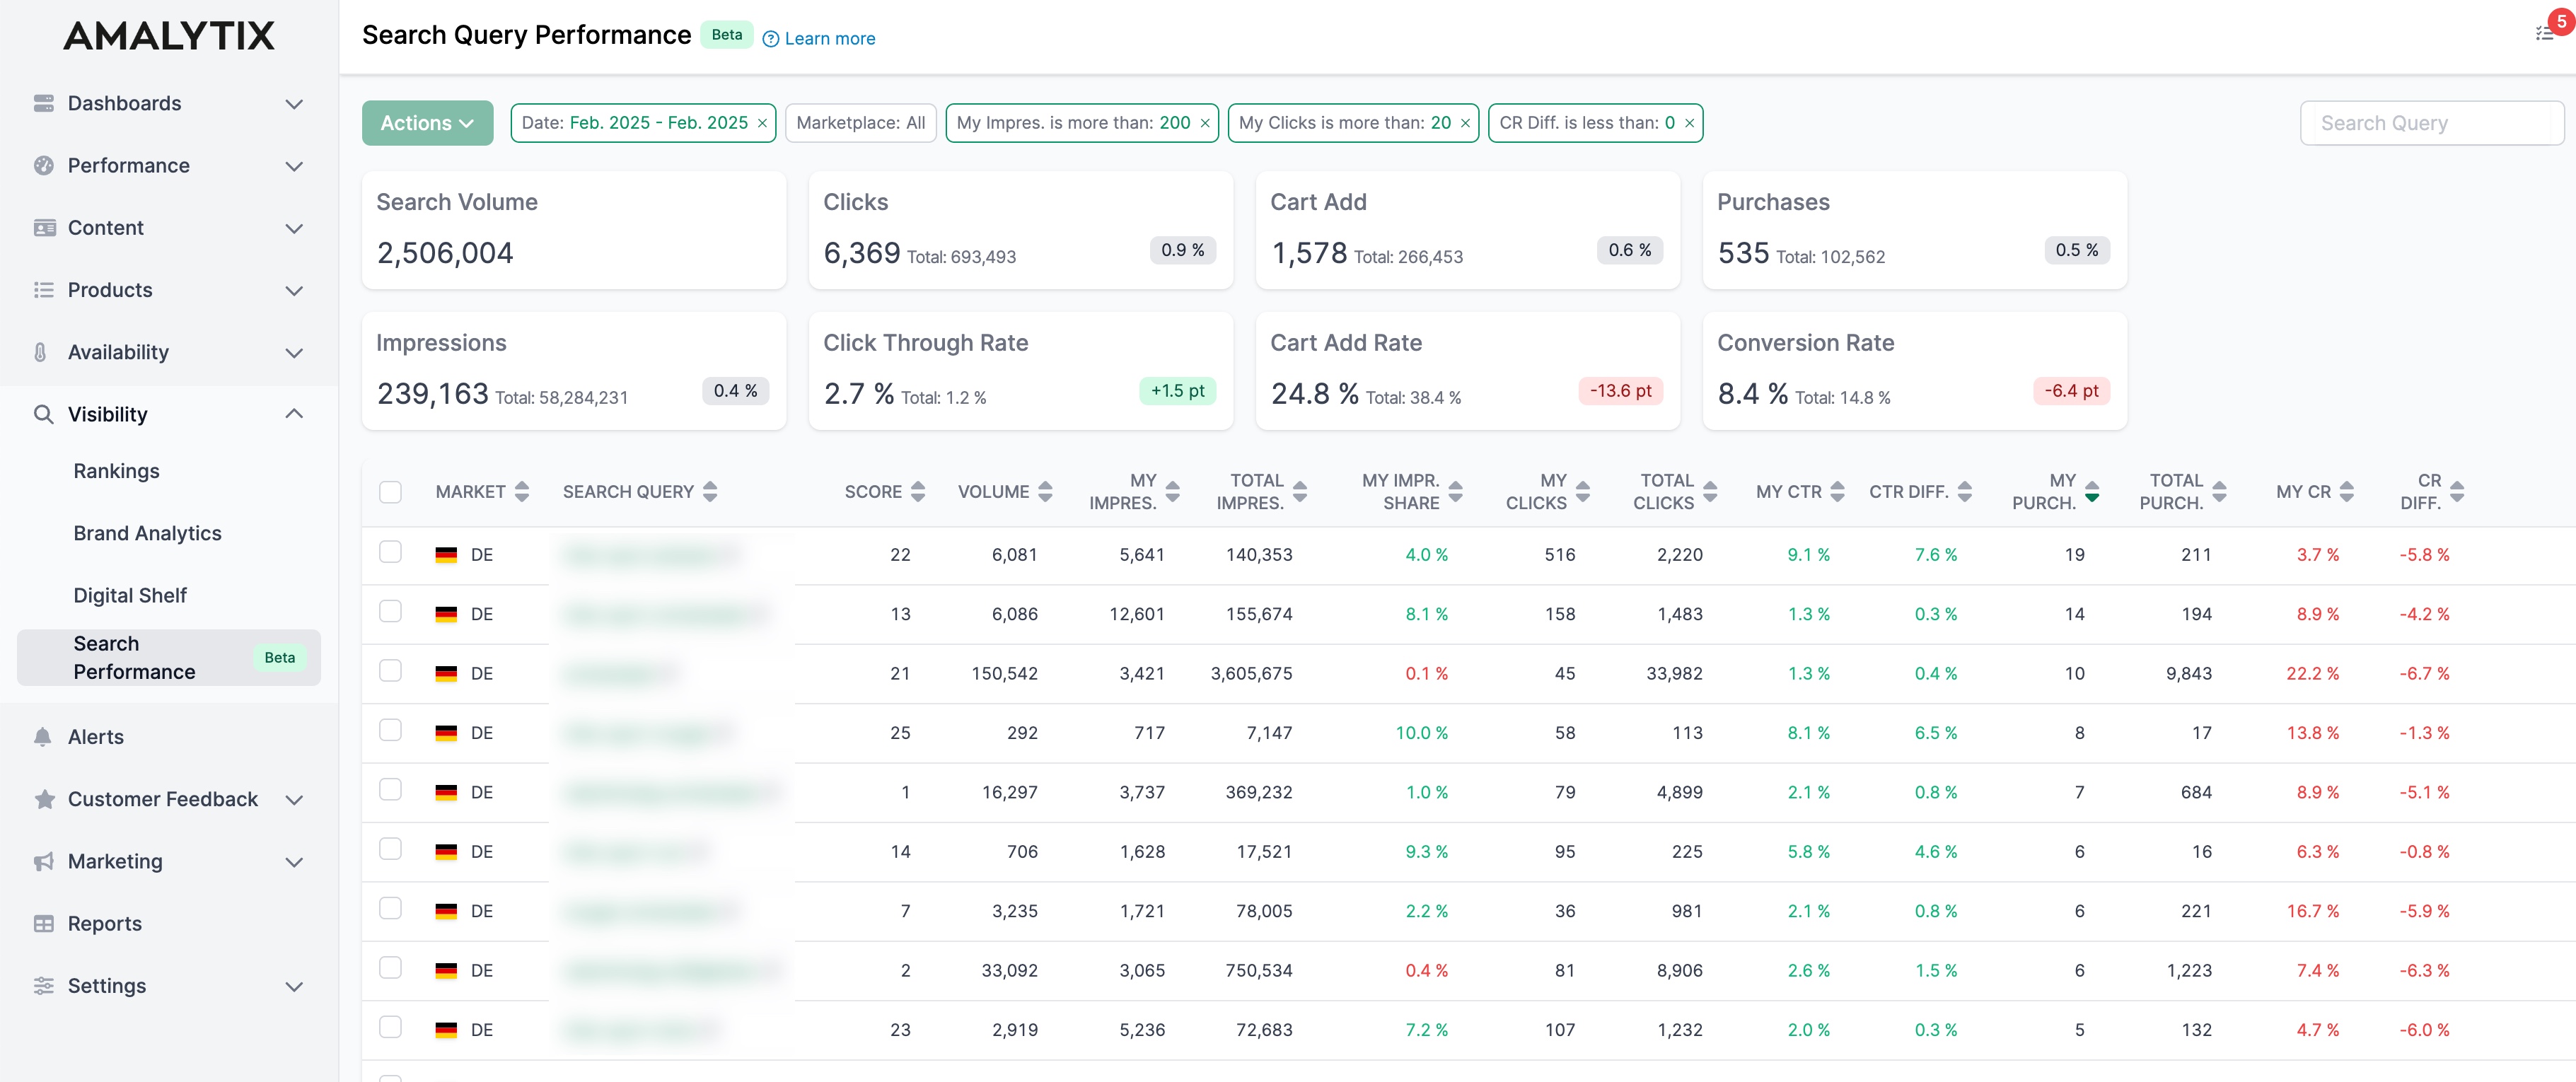
This page displays data from the “Search Query Performance” report, broken down by month and ASIN.
Selecting a Time Period
At the top of the page, you can select your desired time period. The data is updated monthly, building a historical view over time.
Chart
The chart at the top shows the development of your key metrics over time. You can switch between different views:
- Impressions: How often your products were displayed for search queries
- Clicks: How often your products were clicked
- Click-Through Rate (CTR): Ratio of clicks to impressions
- Cart Adds: How often products were added to cart
- Cart Add Rate: Share of clicks that led to cart additions
- Purchases: Number of completed purchases
- Conversion Rate: Ratio of purchases to clicks
- All Brand Values: Combined view of your values
- All Market Values: Combined view of market values
- All Values: Comparison of your values with the market
This allows you to see at a glance when visibility and performance have changed.
KPI Tiles
Below the chart, you’ll find the most important metrics for the selected period:
| Metric | Description | Why It Matters |
|---|---|---|
| Search Query Volume | Total search volume for your keywords | Shows market demand |
| Impressions | How often your products were shown | Measures your visibility |
| Clicks | Number of clicks on your products | Shows interest in your products |
| Click-Through Rate | Share of impressions that led to clicks | Shows how attractive your listings are |
| Added to Cart | How often products were added to cart | Measures purchase intent |
| Cart Add Rate | Share of clicks with cart additions | Shows how convincing your product pages are |
| Purchases | Number of completed orders | Your business result |
| Conversion Rate | Share of clicks that led to purchases | Shows how effective your listings are |
Each tile shows the current value and the change compared to the previous period (e.g., as a percentage or point difference). This lets you immediately see if the metric has improved or declined.
Comparison with the Market
A key advantage of AMALYTIX: You can compare your performance directly with the overall market. The tiles show not only your values but also the difference to the market average. This helps you identify where you’re performing better or worse than competitors.
Detail Table
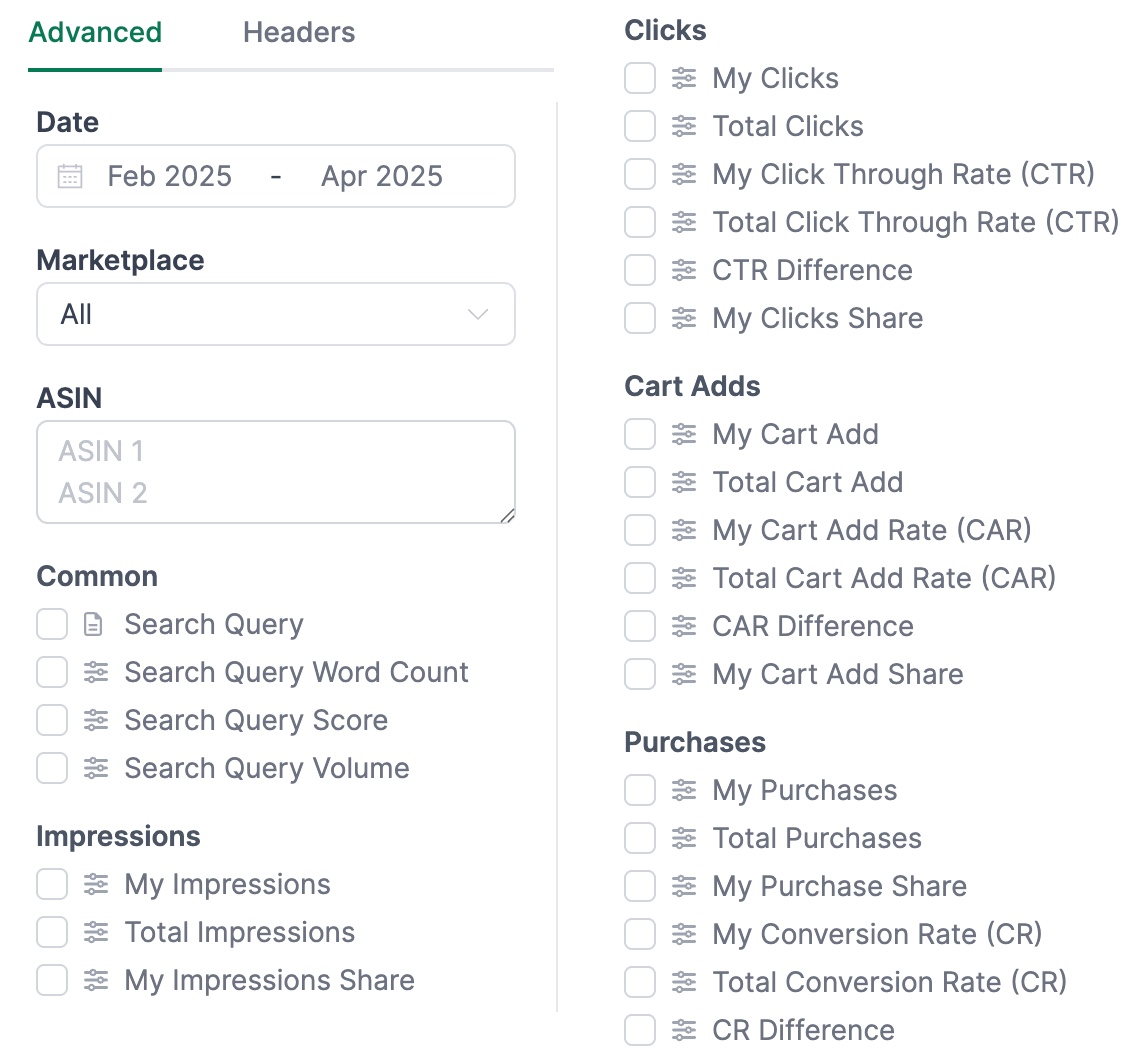
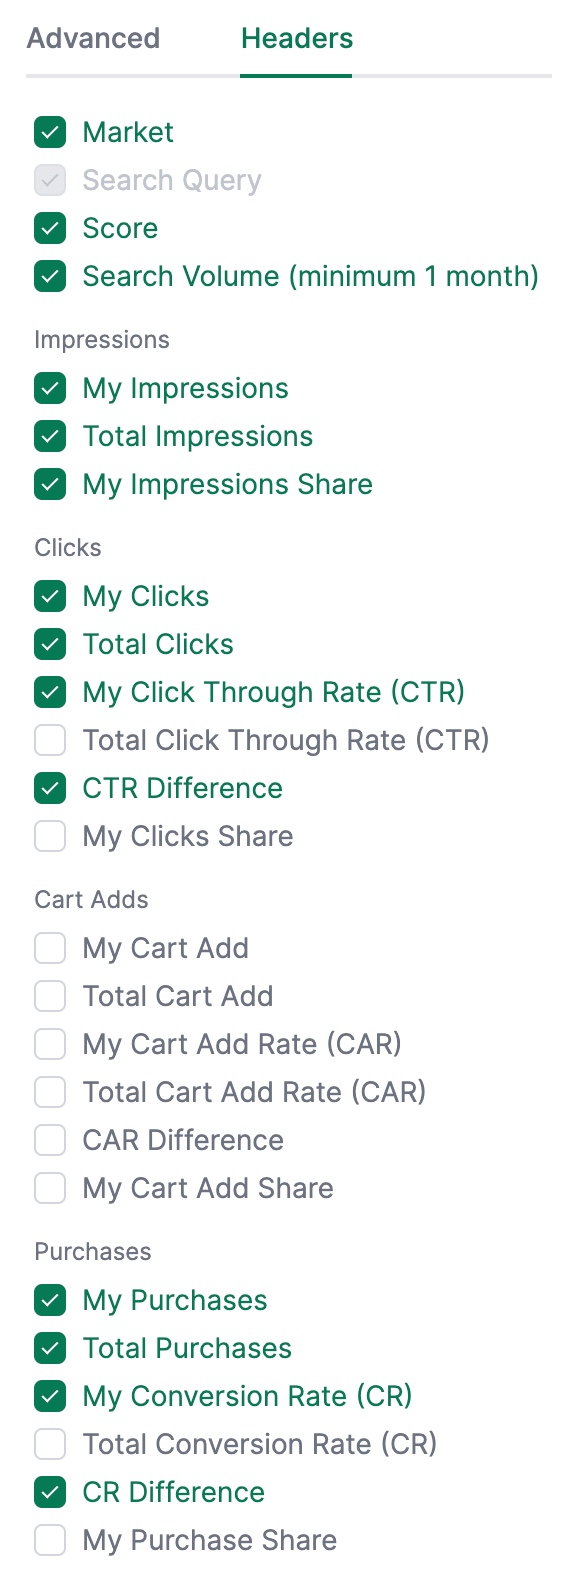
Below the tiles, you’ll find a detailed table at the search term level. Key columns include:
- Search Term: The analyzed keyword
- Rank: Position in the search volume ranking
- Search Volume: Monthly search volume
- Impressions: Your impressions and total impressions
- Impression Share: Your share of all impressions
- Clicks: Your clicks and total clicks
- CTR & CTR Difference: Your CTR compared to the market
- Sales: Your sales and total sales
- CR & CR Difference: Your conversion rate compared to the market
Filters
Unlike in Seller Central, AMALYTIX allows you to filter the data with much greater flexibility. Filter by:
- Time period
- Search term
- Metrics (impressions, clicks, CTR, CR, etc.)
- Difference to market
Saving Filters
You can save your filter settings for reuse. This saves time with recurring analyses.
Predefined Filters
We’ve included predefined filters to help you quickly identify optimization opportunities:

- “Weak CR”: Shows keywords where your conversion rate is lower than the market average. You’re losing potential sales on these keywords - check your price, reviews, or product pages.
- “Weak CTR”: Shows keywords where your click-through rate (CTR) is lower than the market average. Your products are being displayed but clicked less often on these keywords - optimize your title, main image, or price.
Customizing Columns
Some columns are hidden by default to improve clarity. You can show them at any time via the columns menu.
Exporting Data
Click the download button to export the data as an Excel file. This allows you to further analyze the data or share it with your team.
Further Information
For a deeper dive into this report, please read our blog article: Explaining the Amazon Search Query Performance Report in Detail.
Related Topics
- Keyword Research - Find new relevant keywords
- Content Analysis - Optimize your listings based on your insights