Amazon Seller Dashboard
Overview Amazon Dashboard
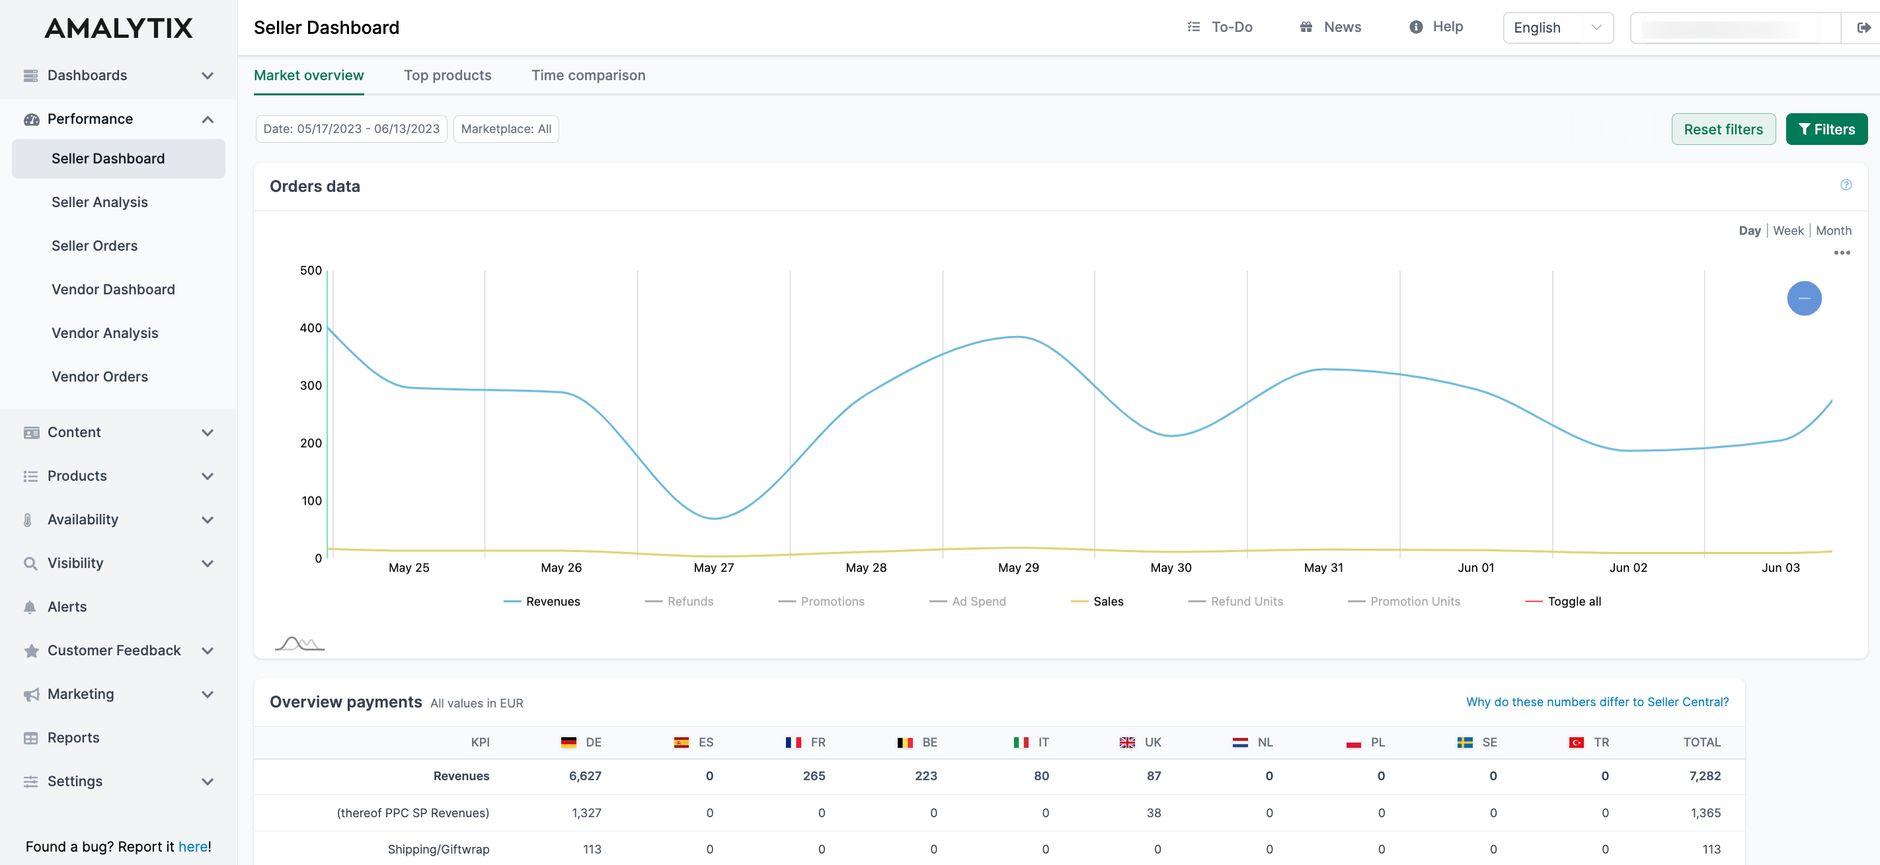
In the realm of success and performance analysis, it is crucial to swiftly grasp the trajectory of your Amazon business and identify the brands and products driving positive or negative trends. To facilitate this, the Seller Dashboard presents essential key performance indicators, enabling you to gain valuable insights.
Market overview
Observe the progress of important key figures
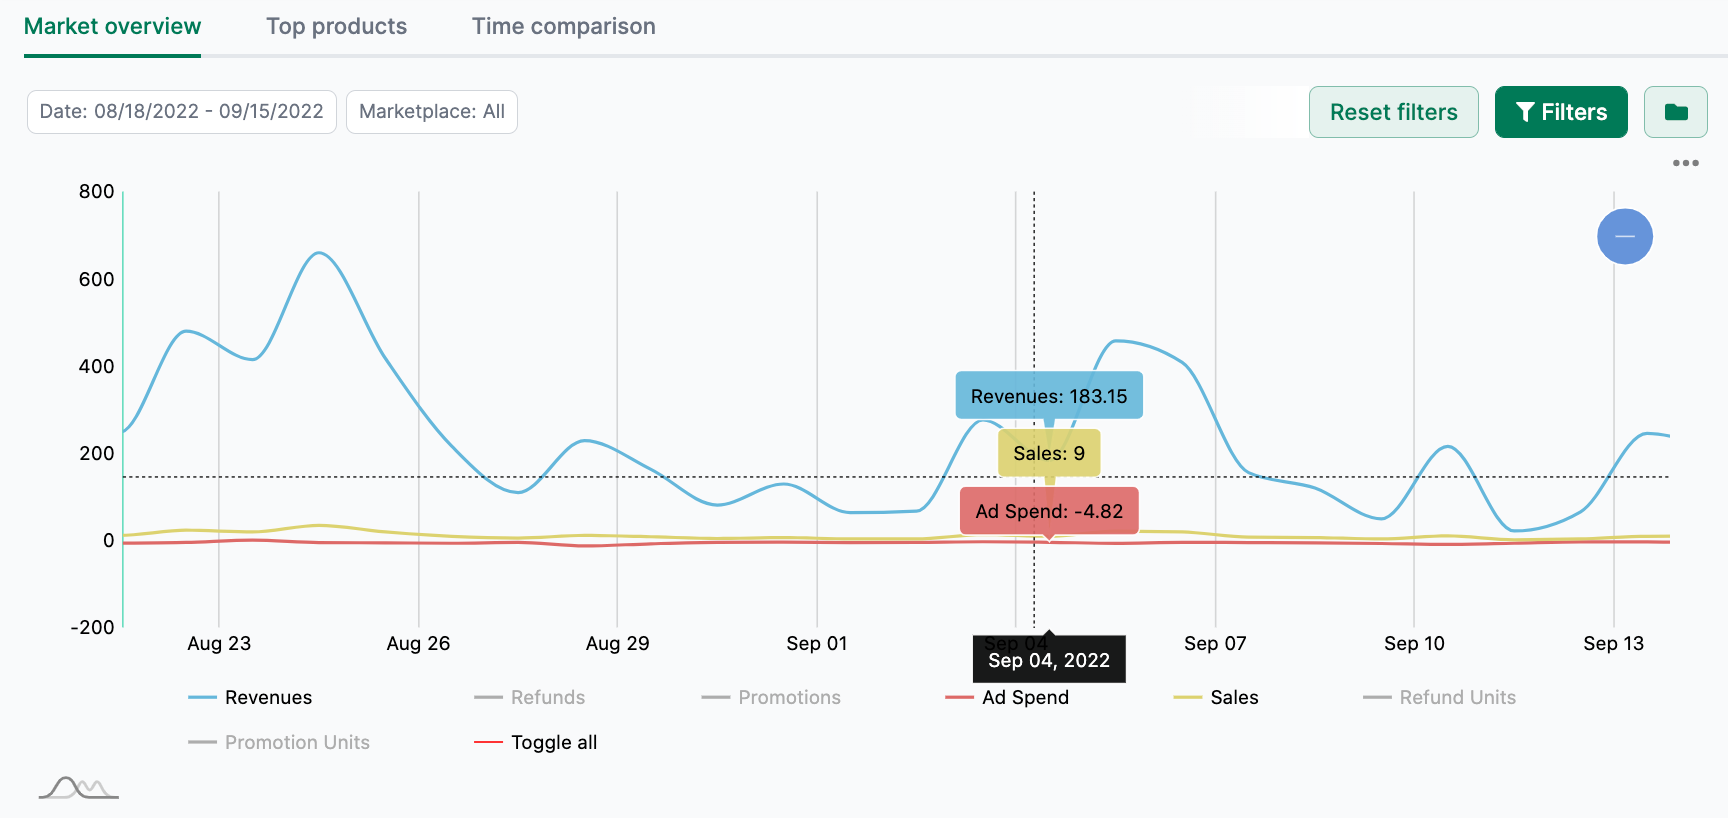
In this chart, you can view the progress of important key figures (revenues, refunds, promotions, ad spend, sales, refund units and promotion units) over time. We use the actual order turnover or sales volume as a basis here. You can reduce the data basis accordingly using filters such as period, marketplace, or tags.
Group your products using tags
Use different tags to group your products. There are no limits to the tags you can choose. A product can also have multiple tags. You can use tags to analyze the performance of single or multiple products.
Payments and Seller Performance
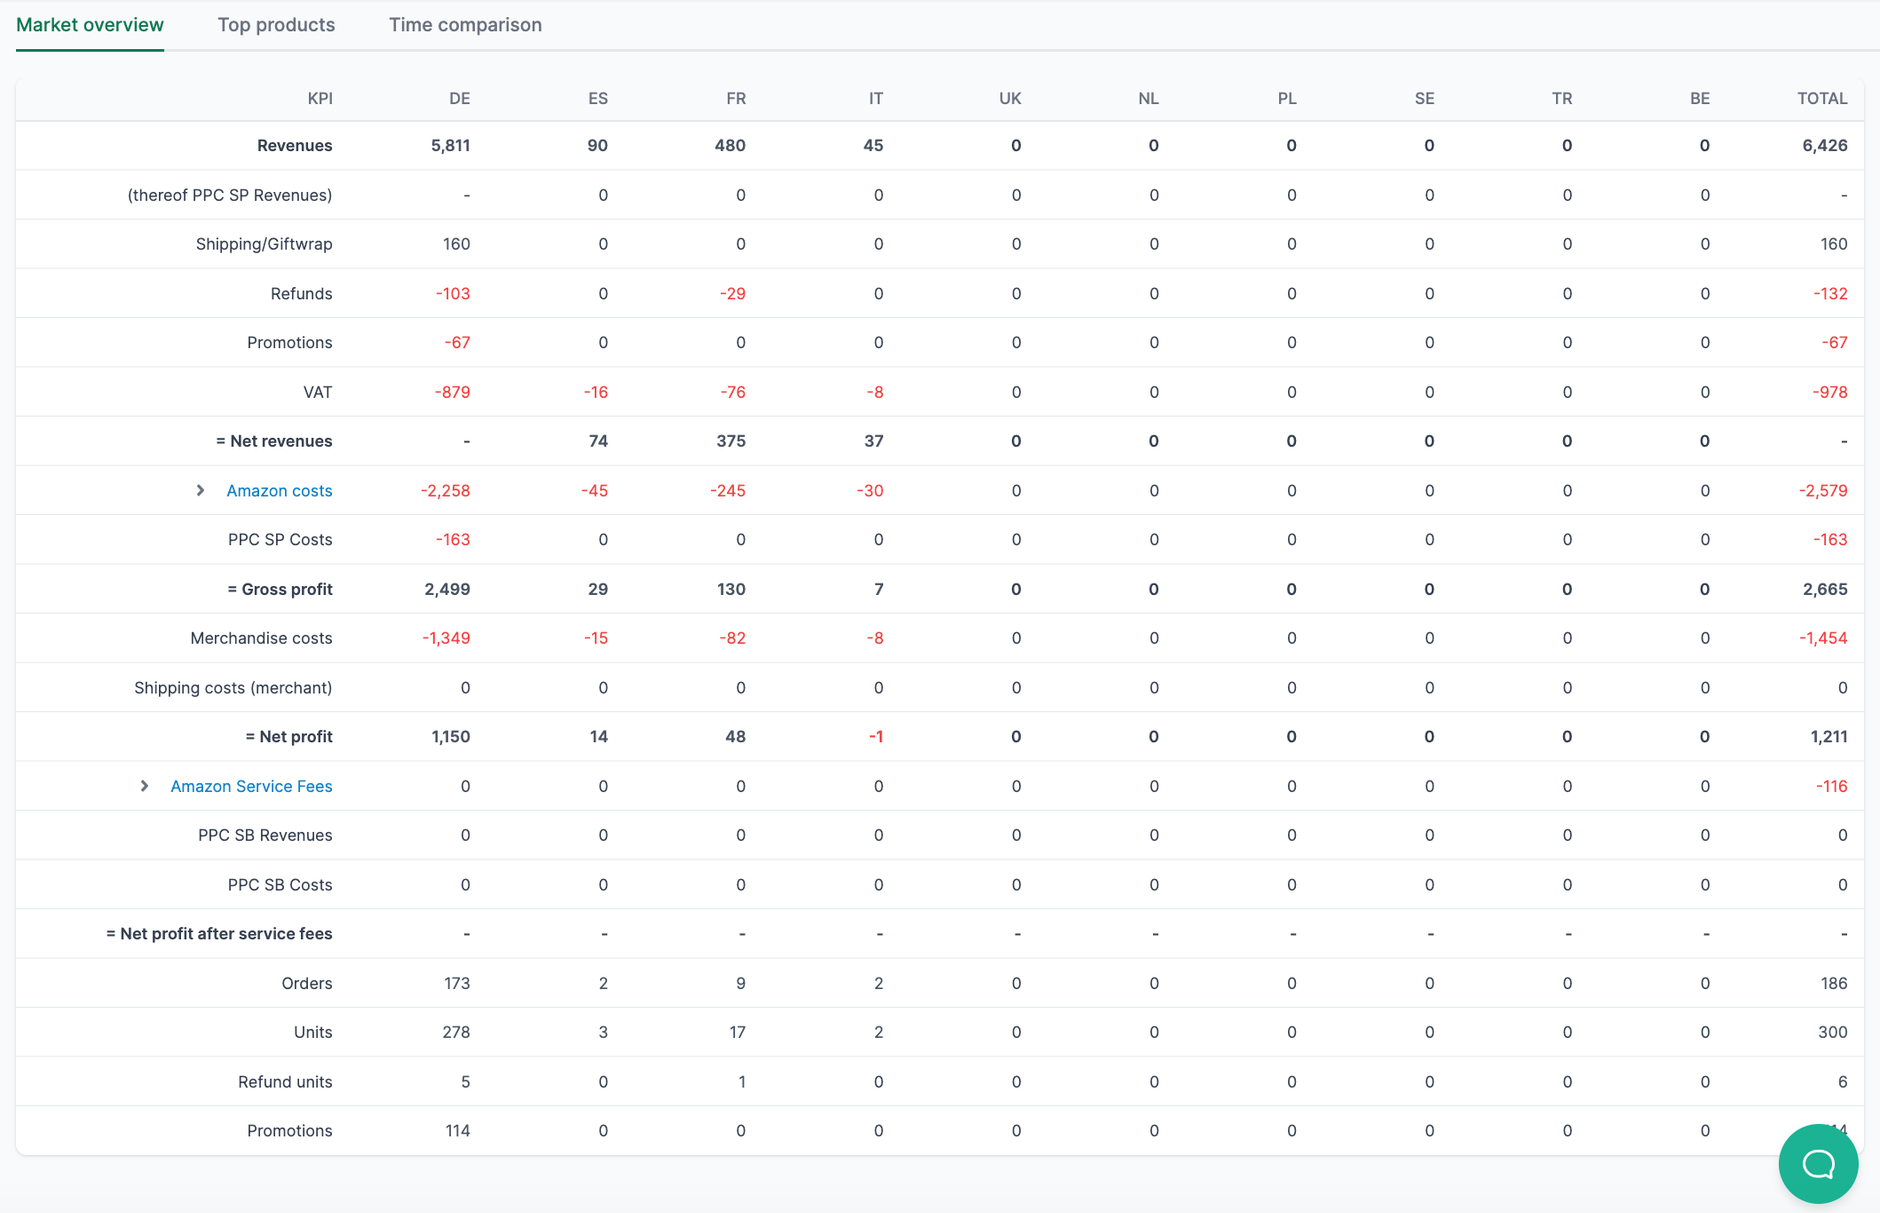
For payments, we analyze the transactions Amazon makes. Every order, return, etc., belongs to a transaction. We put this data here. These transactions can be analyzed in great detail, but they have a slight disadvantage in being somewhat delayed. Therefore, the sales from the payments do not match the sales from the orders. However, the differences are usually not relevant for decision-making.
You can analyze the payments in more detail using the filters mentioned above.
Amazon Top 10 Products
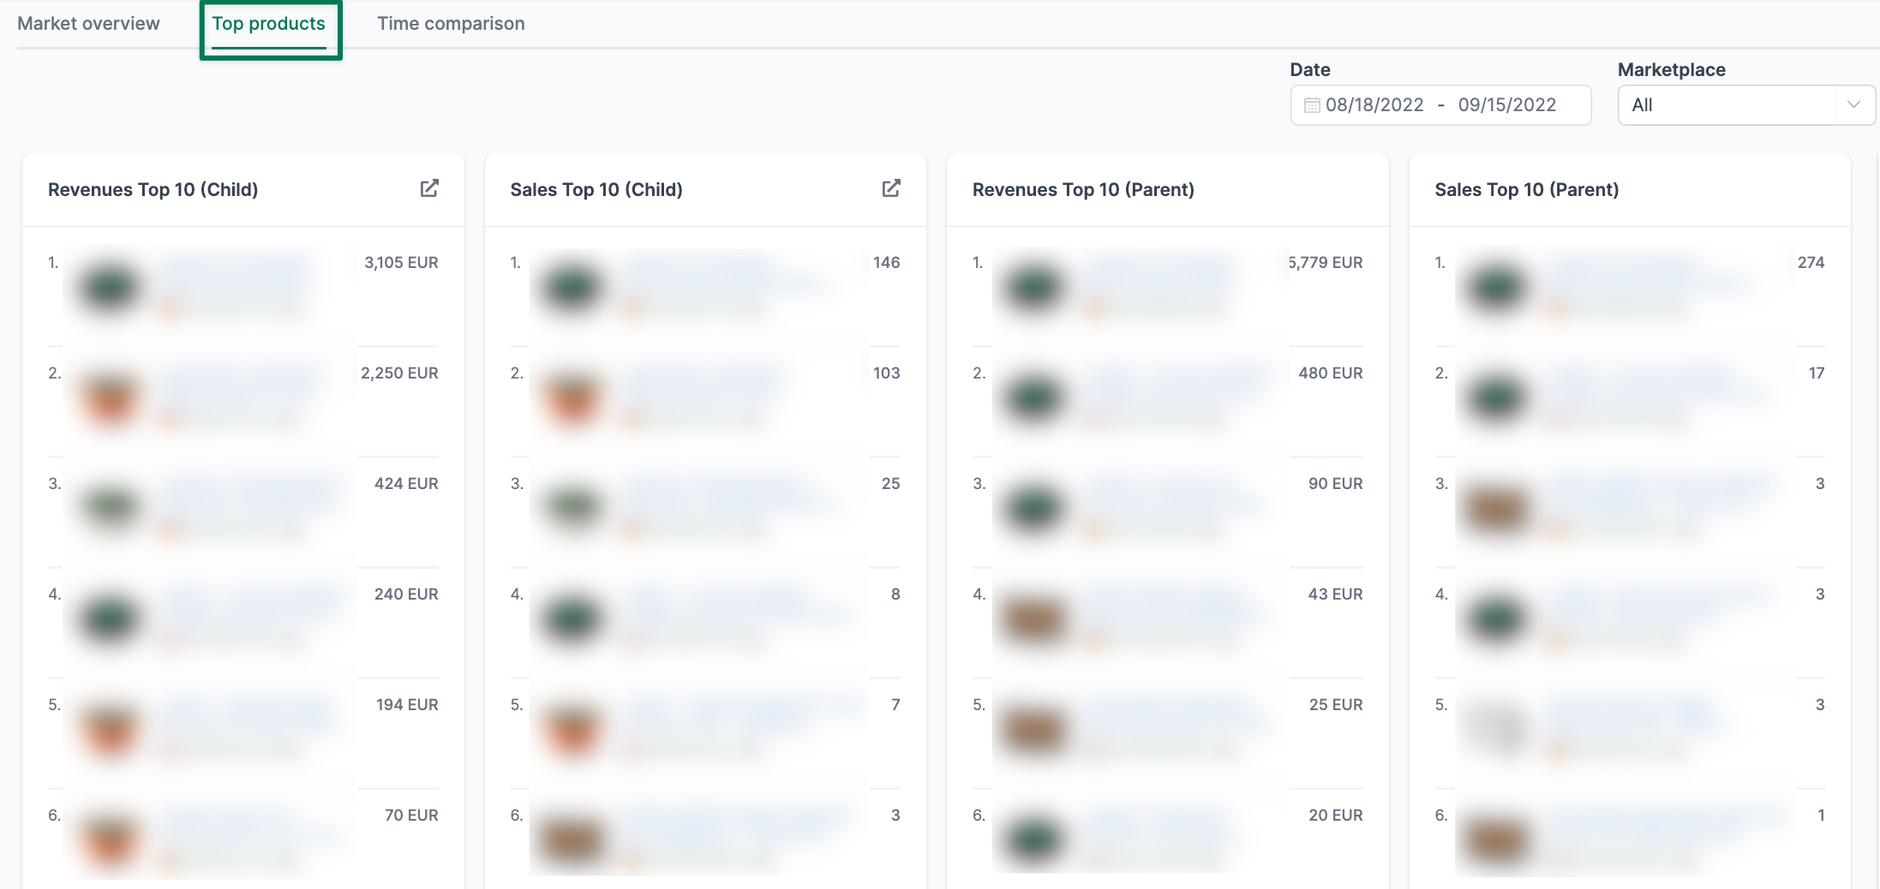
If you click "Top Products" in the top bar, we will show you the parent or child products with the highest values in revenue or sales.
Here you can filter by date and marketplace.
Account development over time
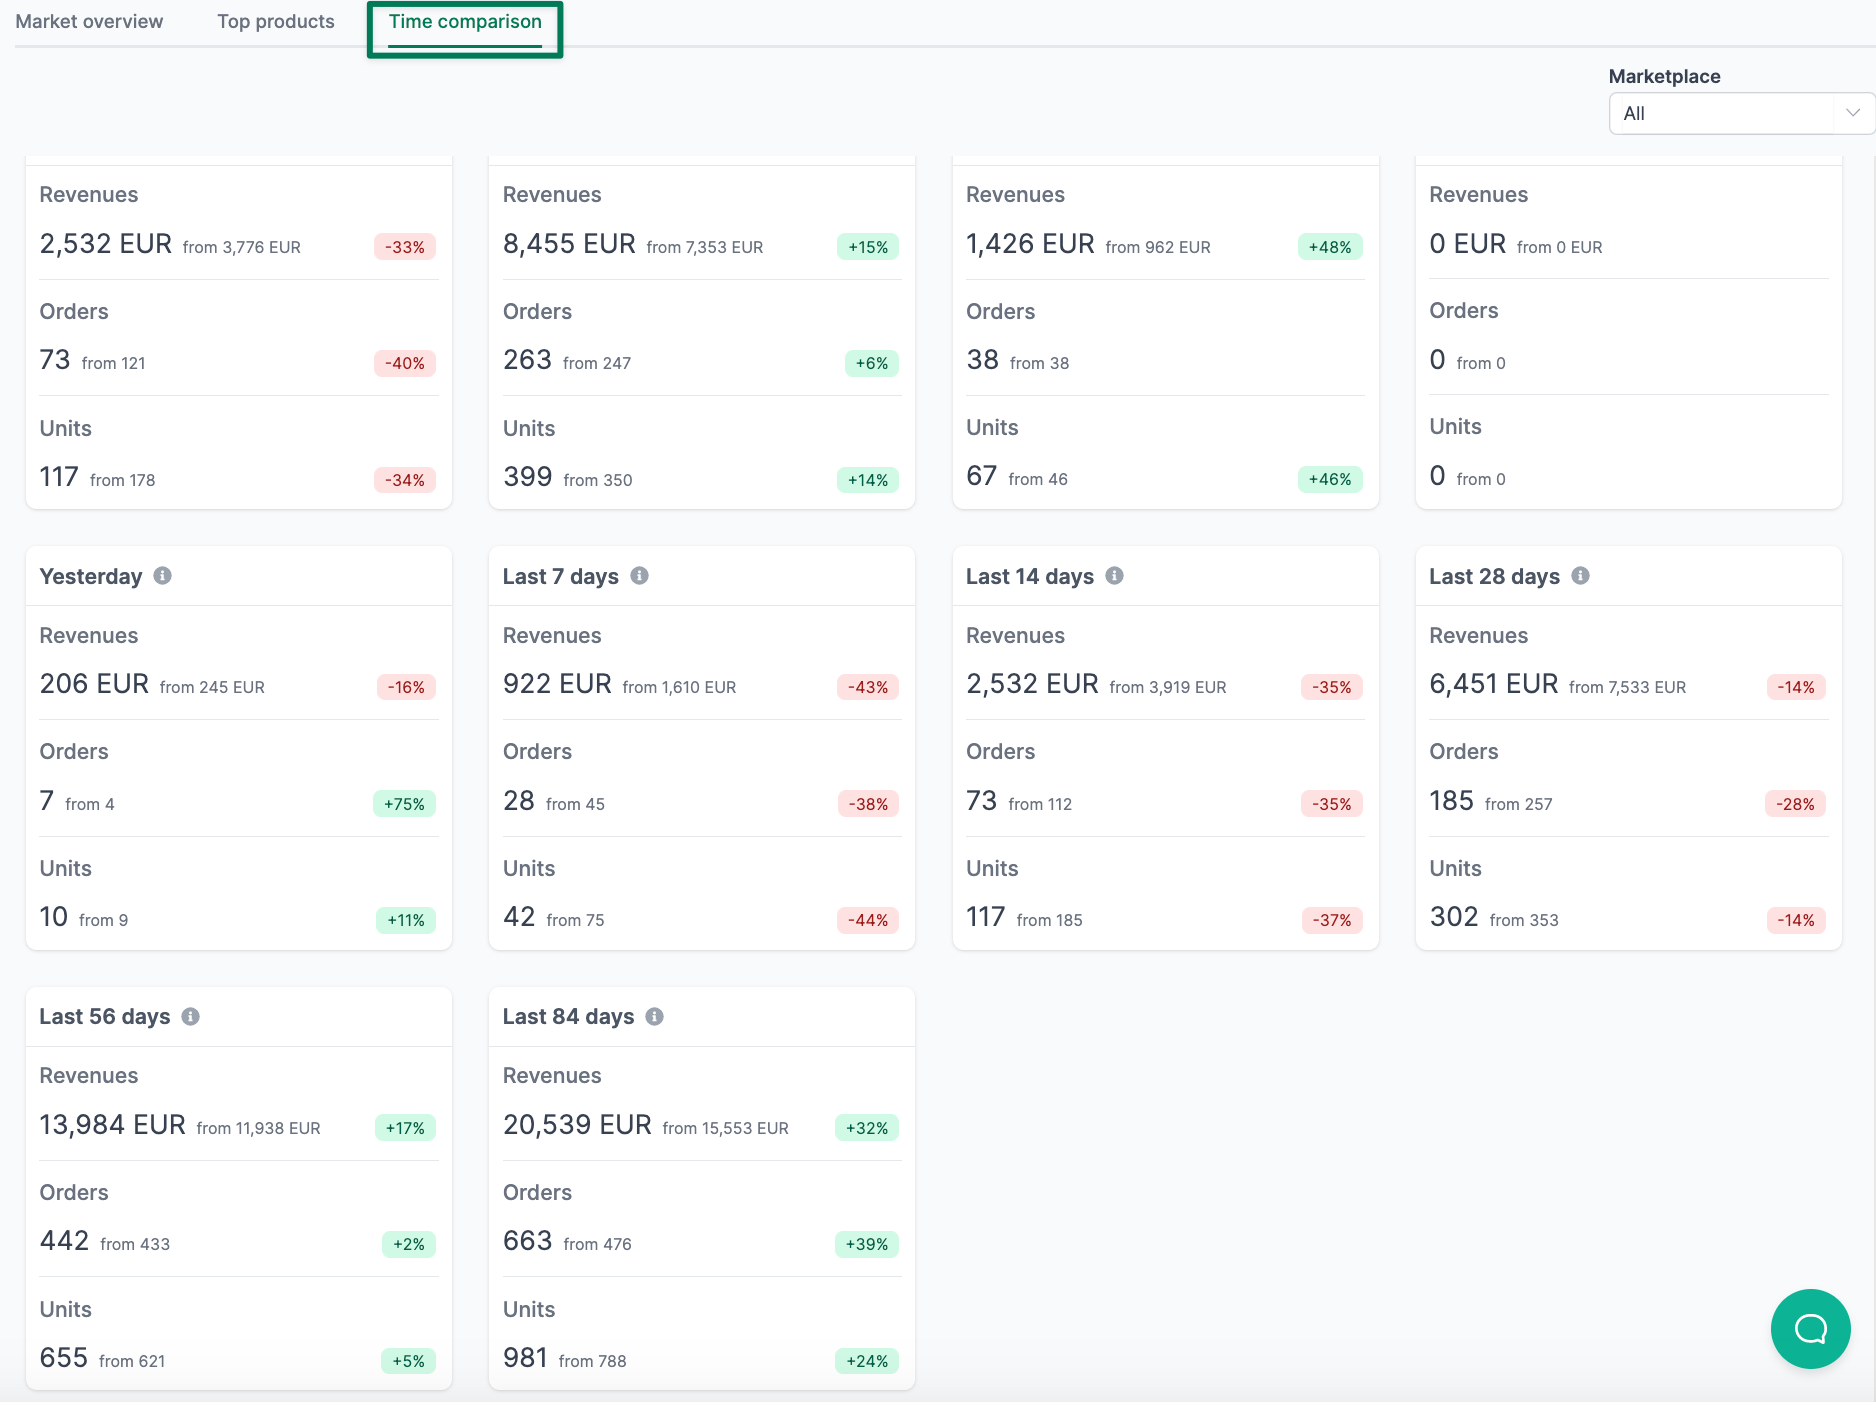
If you click "Time comparison" in the upper bar, we will show you a time comparison for different periods. In each case, sales, number of orders, and number of units are displayed.
You can individually show and hide the individual periods via the selection in the upper right corner.
Here you can filter by marketplaces.
Available Amazon reports
You also have the possibility of exporting specific critical figures as a report. To do this, go to the Financial Events report and set a start and end date, if necessary, to limit the result.
Financial events report
- Description: Report containing amazon charges and fees
- Type: Seller
- Category: Performance
You can find a list of all columns of this report here →.